
View Resource Consumption
KubeSphere metering helps you track resource consumption within a given cluster or workspace at a granular level. Different tenants with different roles can only see the data to which they have access. Besides, you can also set prices for varied resources to see billing information.
Prerequisites
- The Metering and Billing section is accessible to all tenants while the information visible to each of them may be different depending on what roles they have at what level. Note that metering is not a pluggable component of KubeSphere, which means you can use it as long as you have a KubeSphere cluster. For a newly created cluster, you need to wait for about 1 hour to see metering information.
- To see billing information, you need to enable it first.
View Cluster Resource Consumption
Cluster Resource Consumption contains resource usage information of clusters (and nodes included), such as CPU, memory and storage.
-
Log in to the KubeSphere console as
admin, click in the lower-right corner and select Metering and Billing.
 -
Click View Consumption in the Cluster Resource Consumption section.
-
On the left side of the dashboard, you can see a cluster list containing your Host Cluster and all Member Clusters if you have enabled multi-cluster management. There is only one cluster called
defaultin the list if it is not enabled.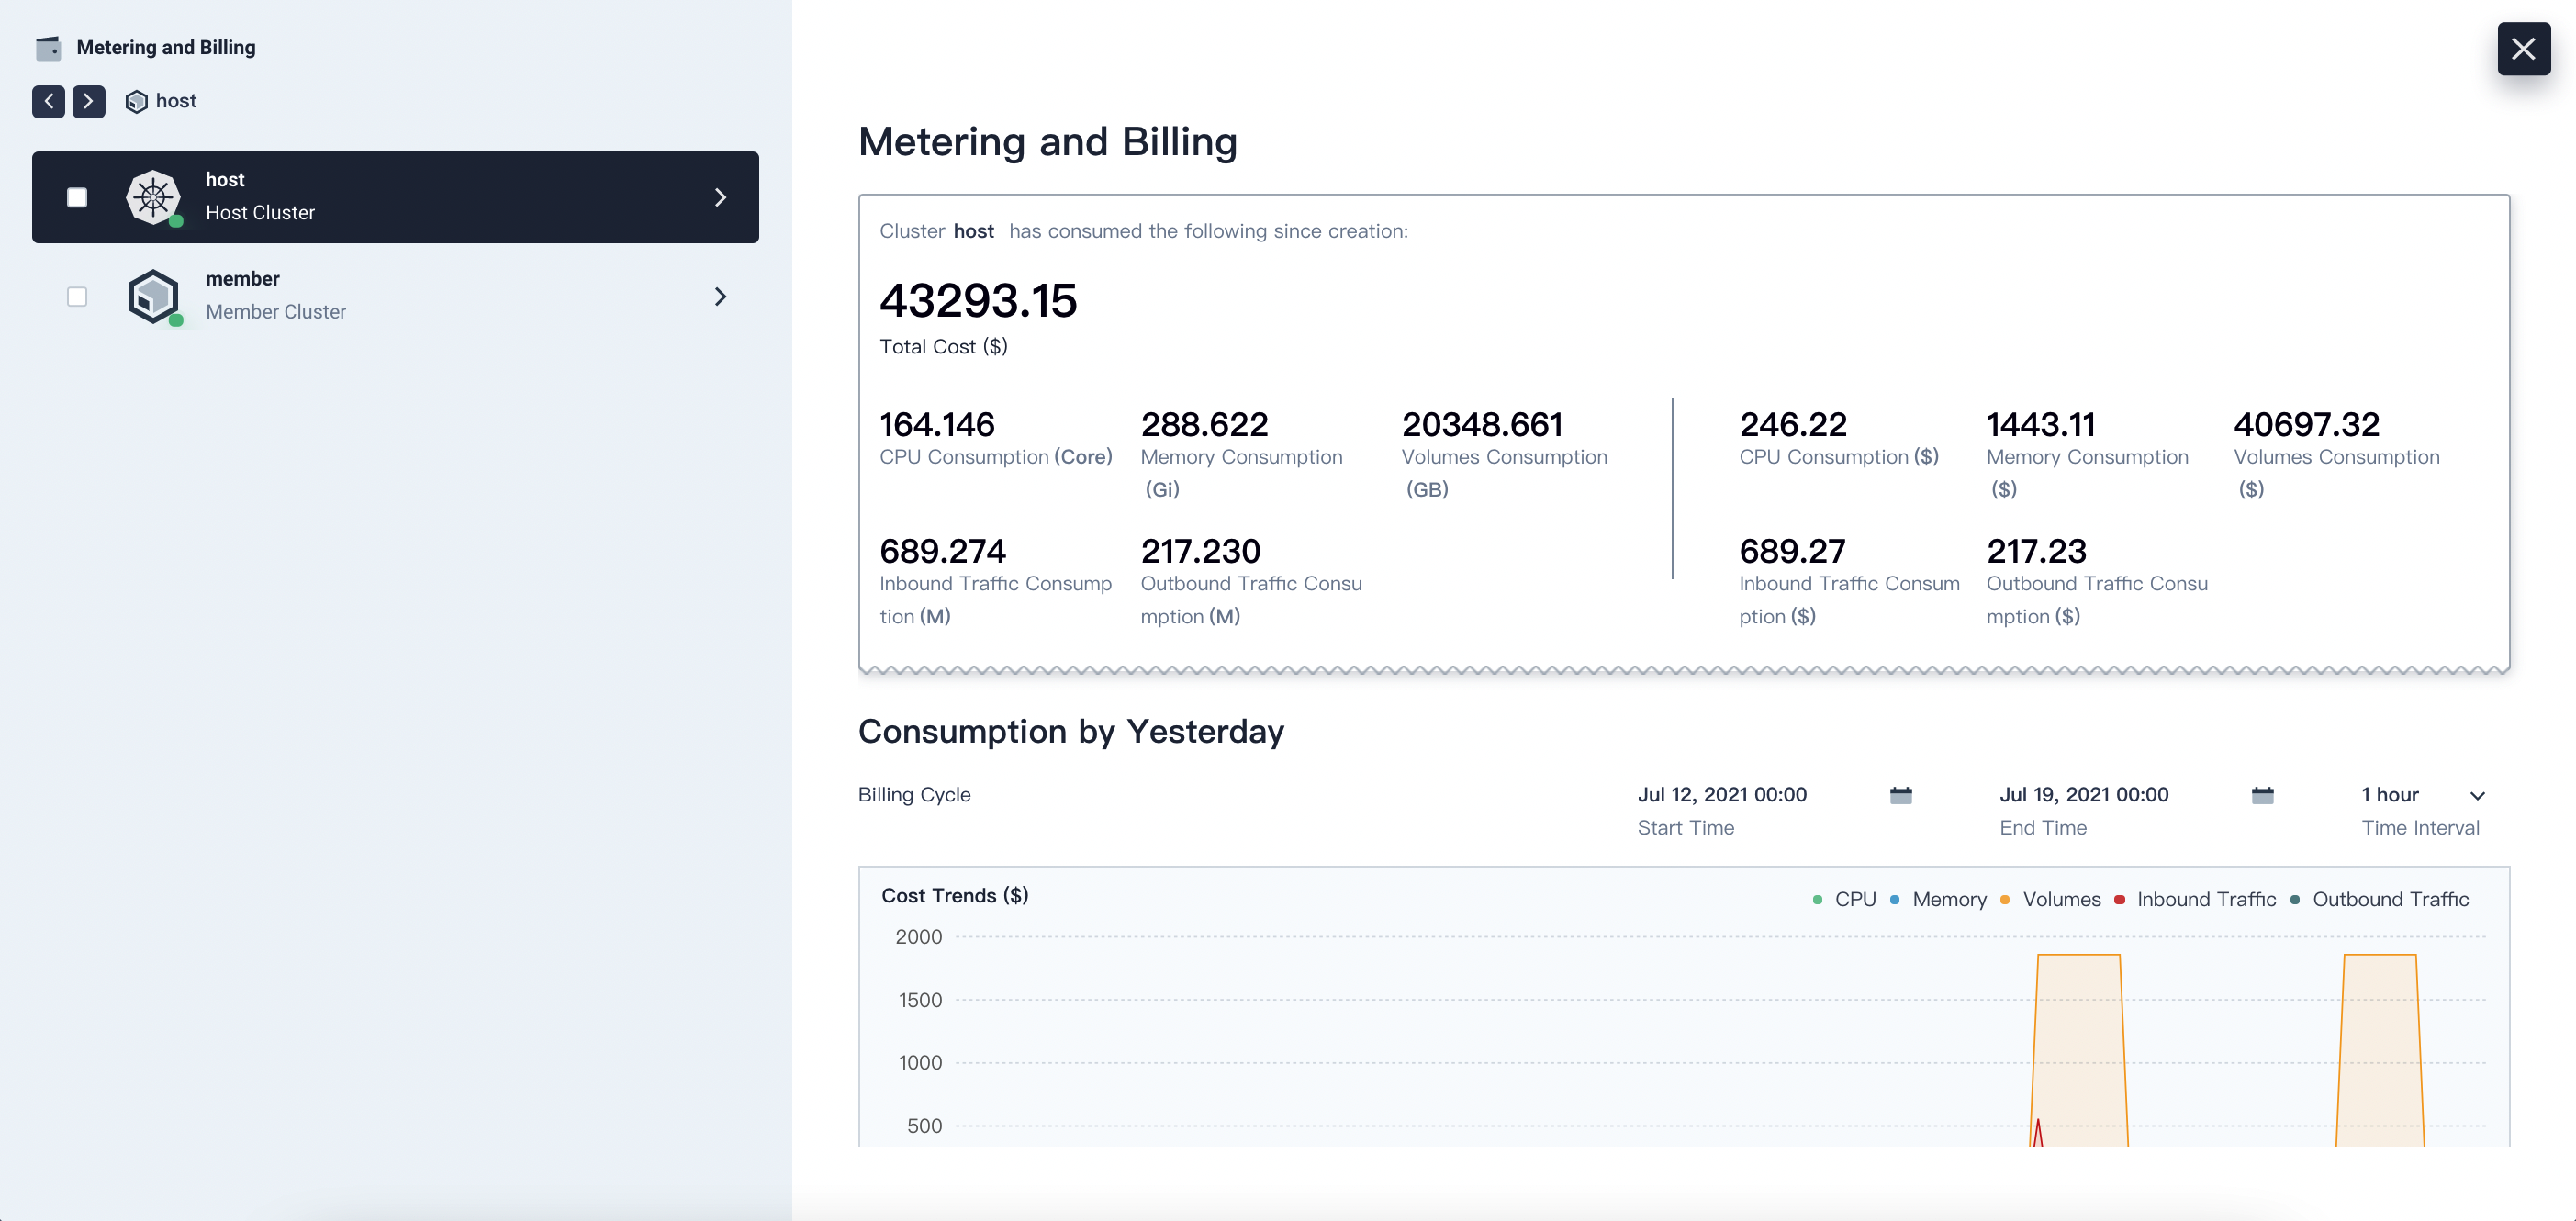
On the right side, there are three parts showing resource consumption in different ways.
Module Description Overview Displays a consumption overview of different resources in a cluster since its creation. You can also see the billing information if you have set prices for these resources in the ConfigMap kubesphere-config.Consumption by Yesterday Displays the total resource consumption by yesterday. You can also customize the time range and internal to see data within a specific period. Current Resources Included Displays the consumption of resources included in the selected target object (in this case, all nodes in the selected cluster) over the last hour. -
You can click a cluster on the left and dive deeper into a node or Pod to see detailed consumption information.
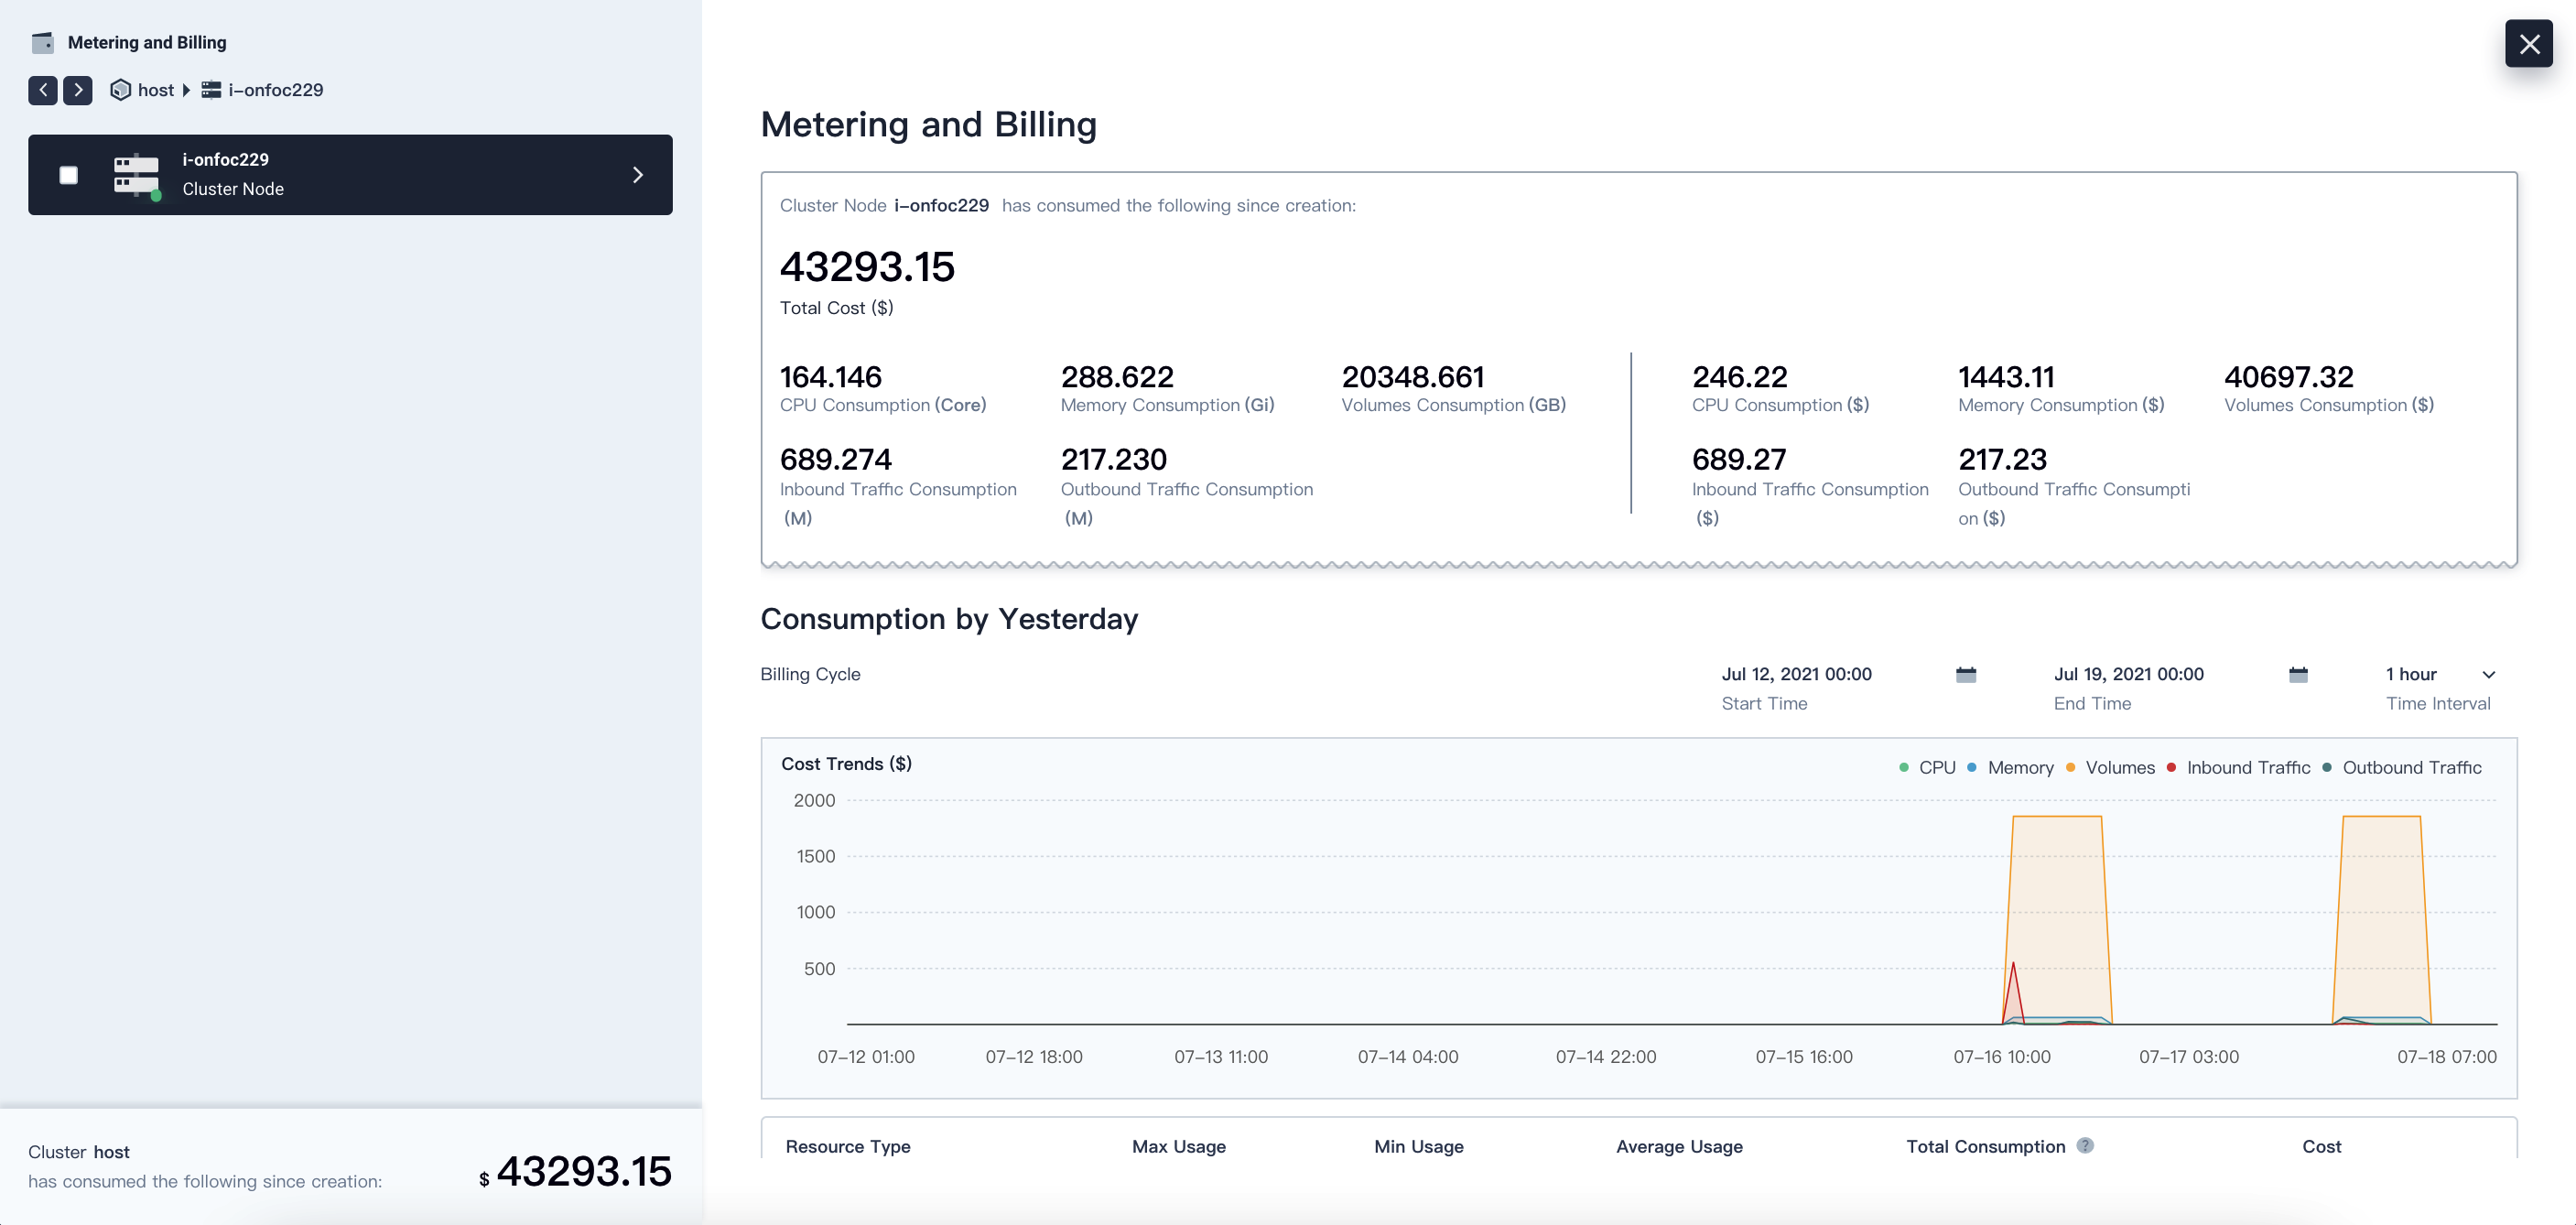
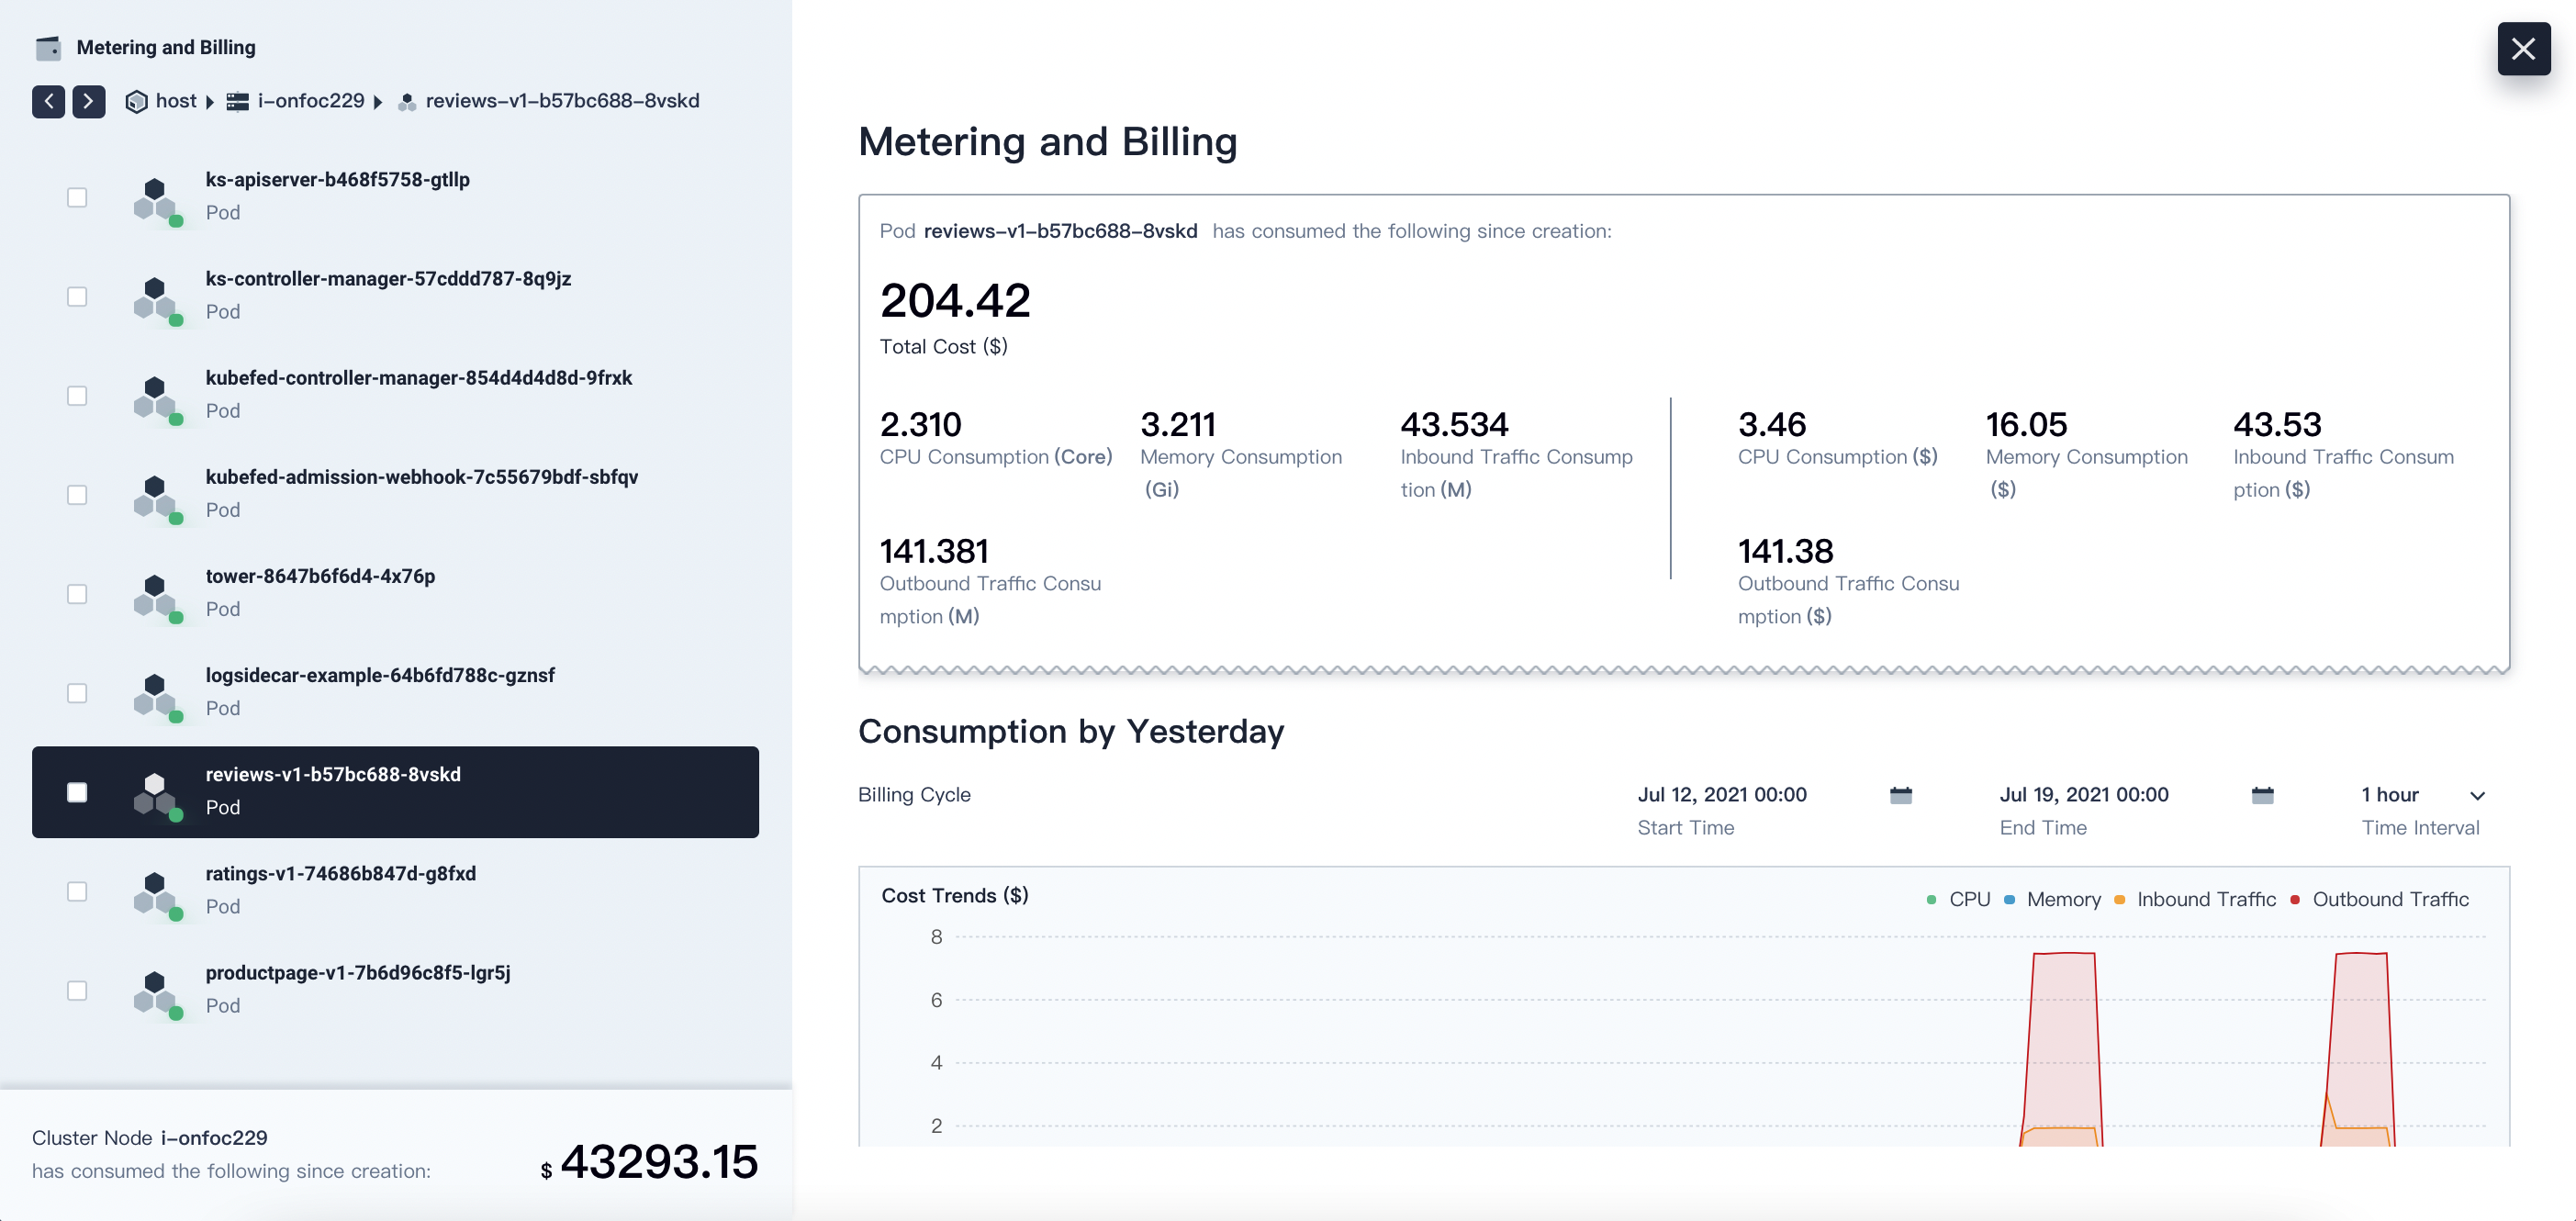
Note
To export the metering and billing data of an object as a CSV file, select the checkbox on the left and click ✓.
View Workspace (Project) Resource Consumption
Workspace (Project) Resource Consumption contains resource usage information of workspaces (and projects included), such as CPU, memory and storage.
-
Log in to the KubeSphere console as
admin, click in the lower-right corner and select Metering and Billing.
 -
Click View Consumption in the Workspace (Project) Resource Consumption section.
-
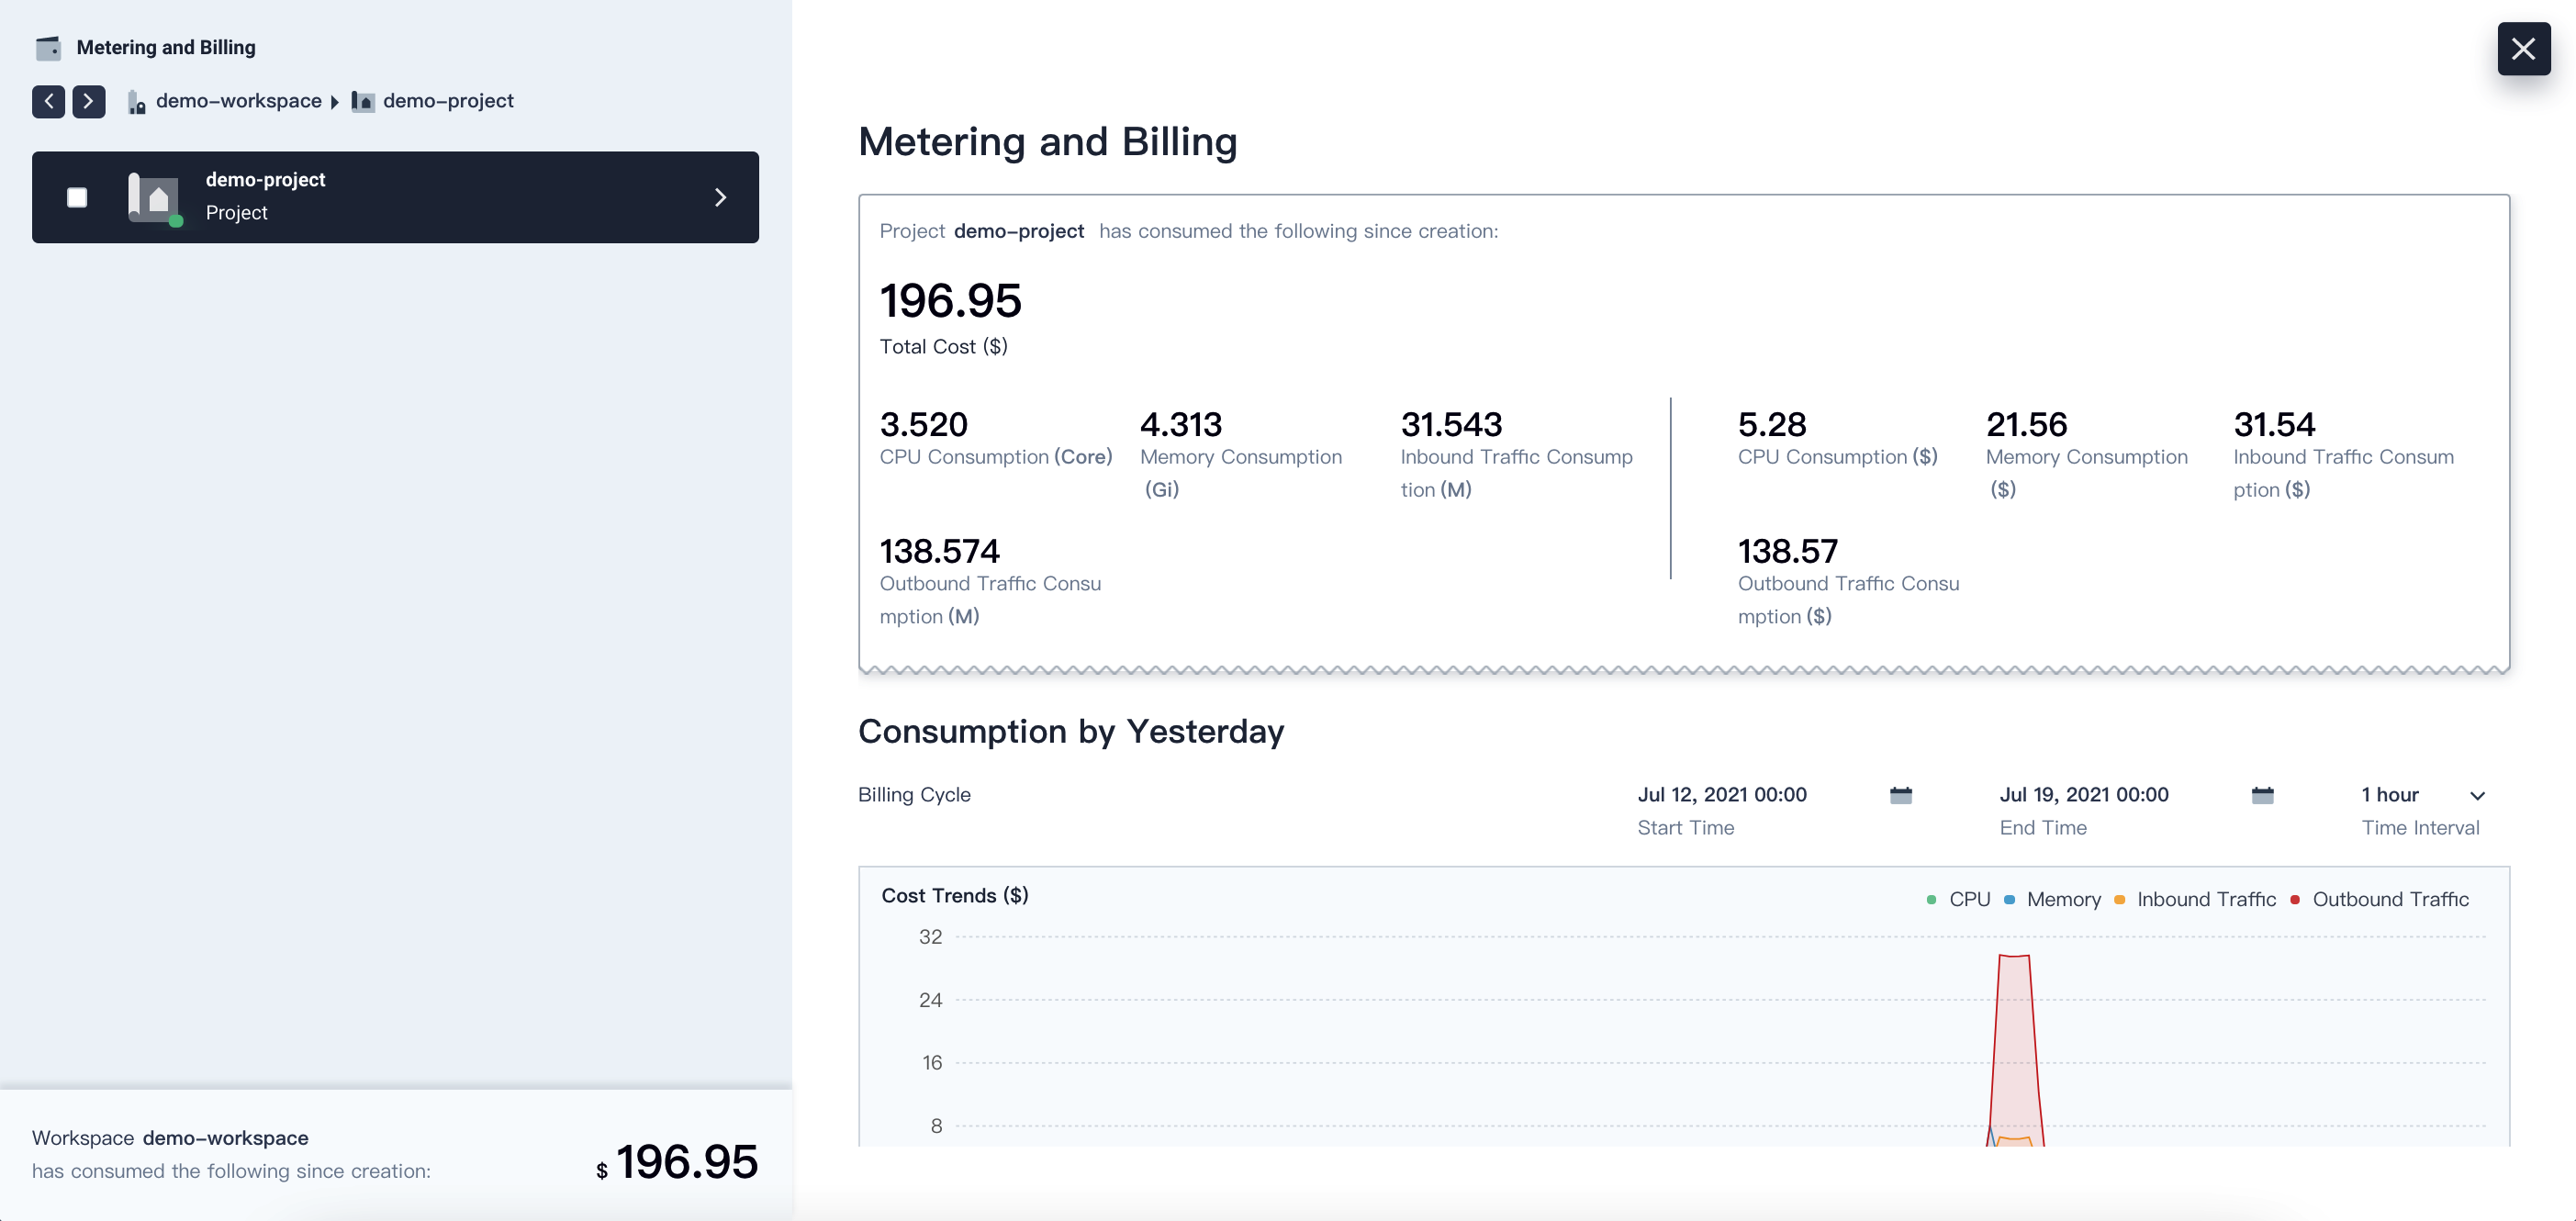
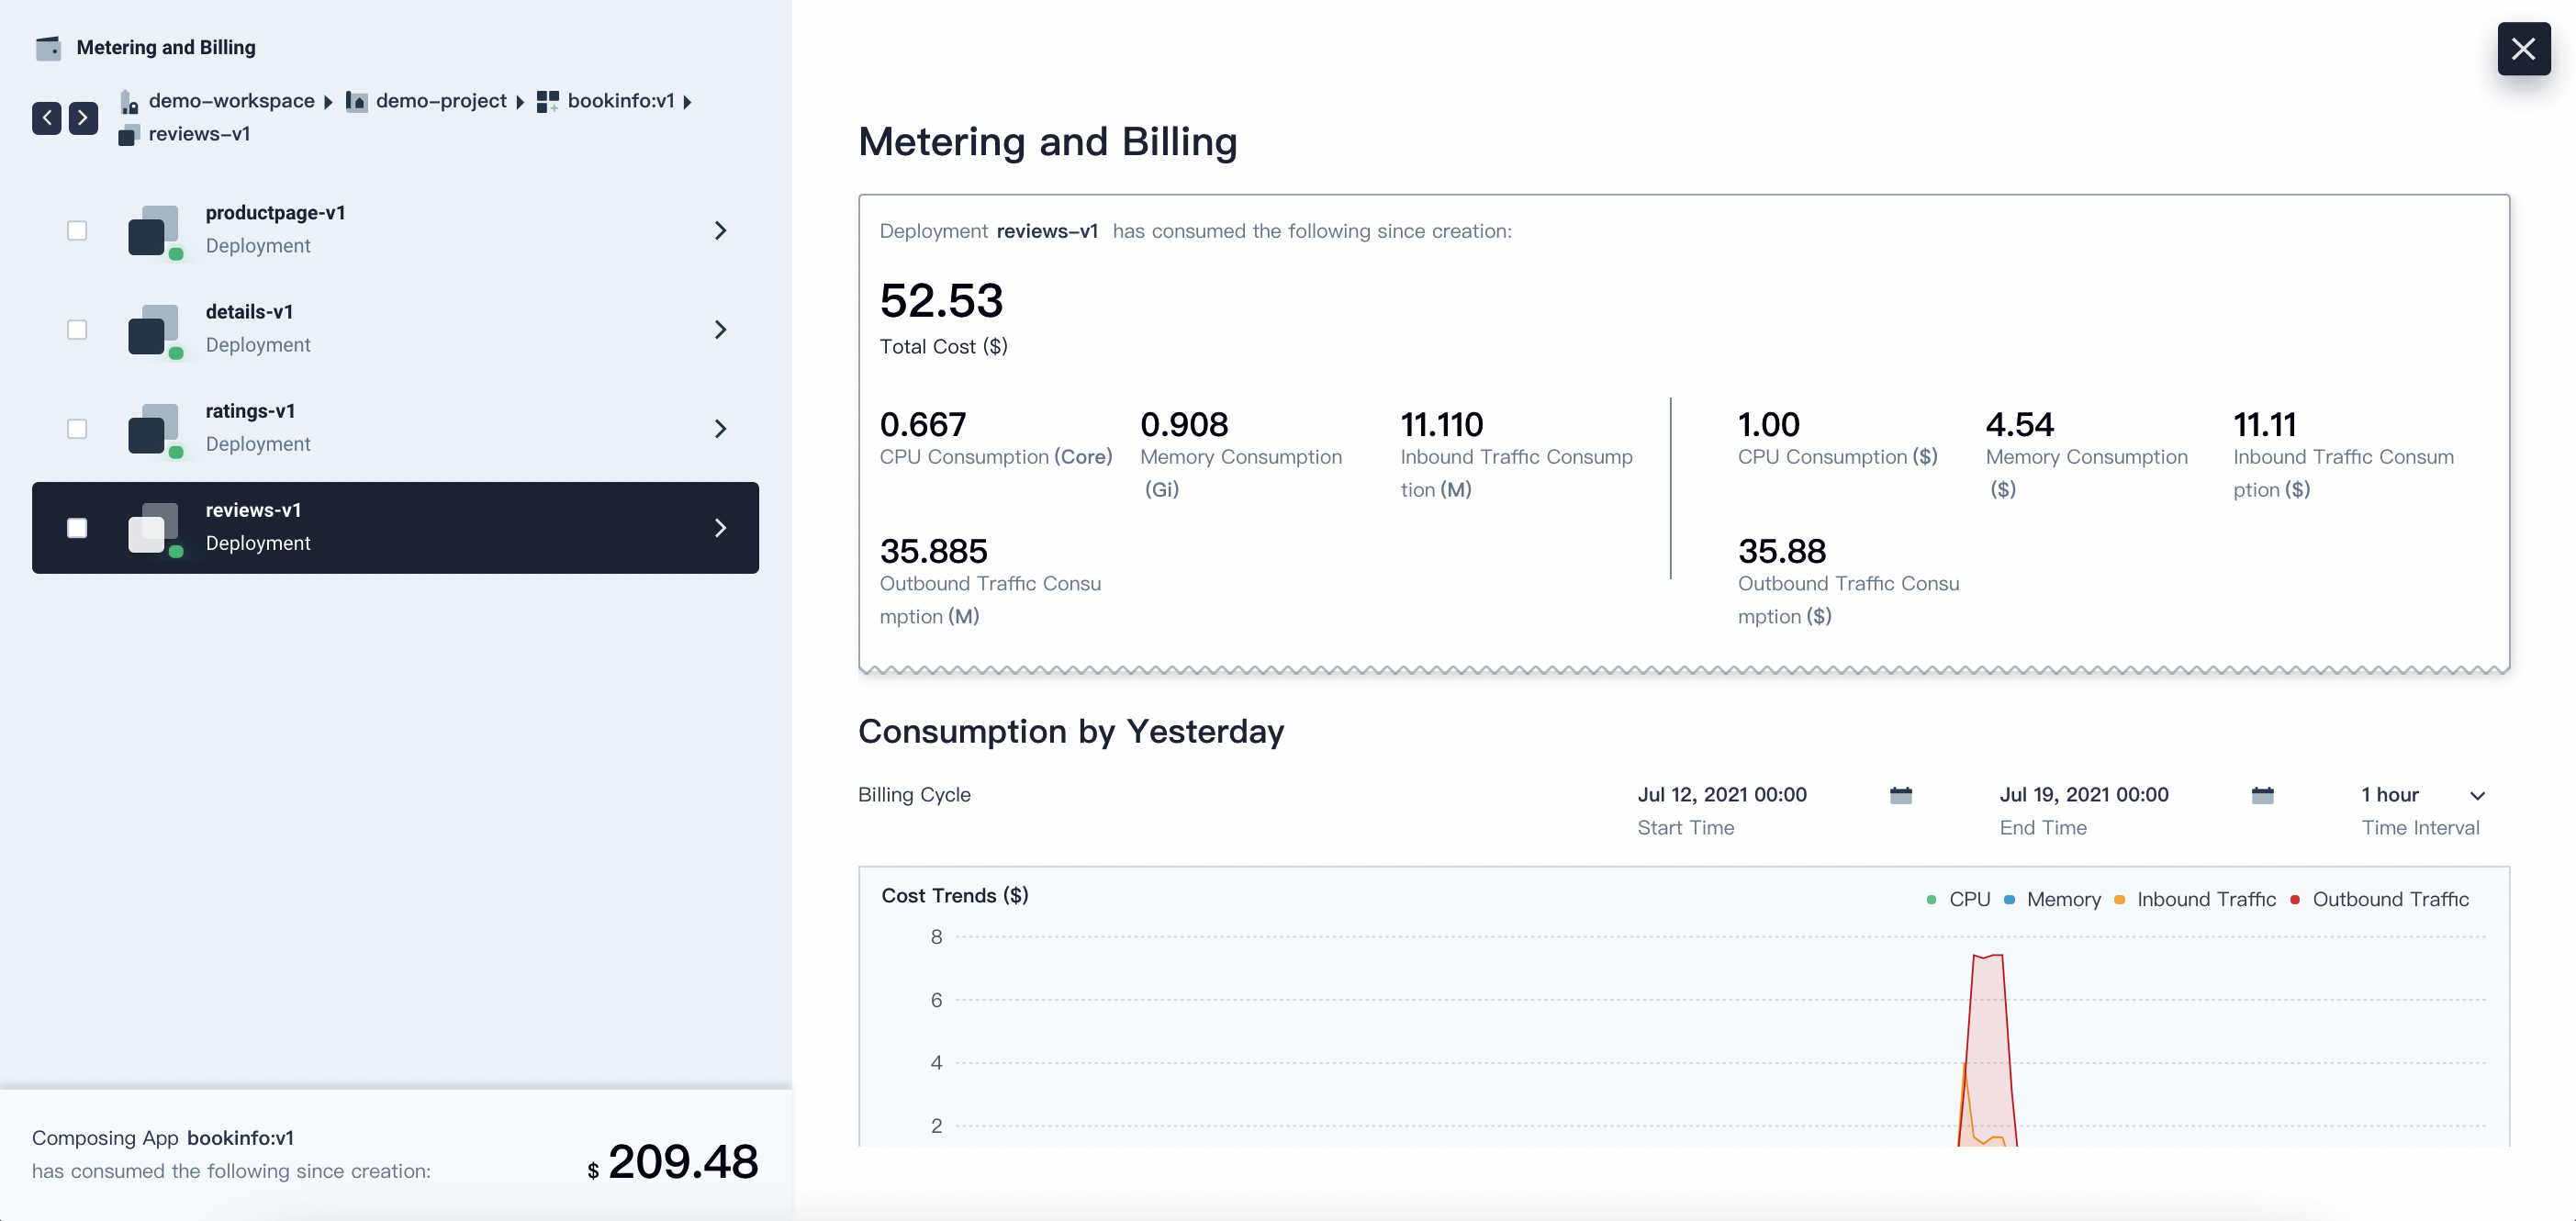
On the left side of the dashboard, you can see a list containing all the workspaces in the current cluster. The right part displays detailed consumption information in the selected workspace, the layout of which is basically the same as that of a cluster.
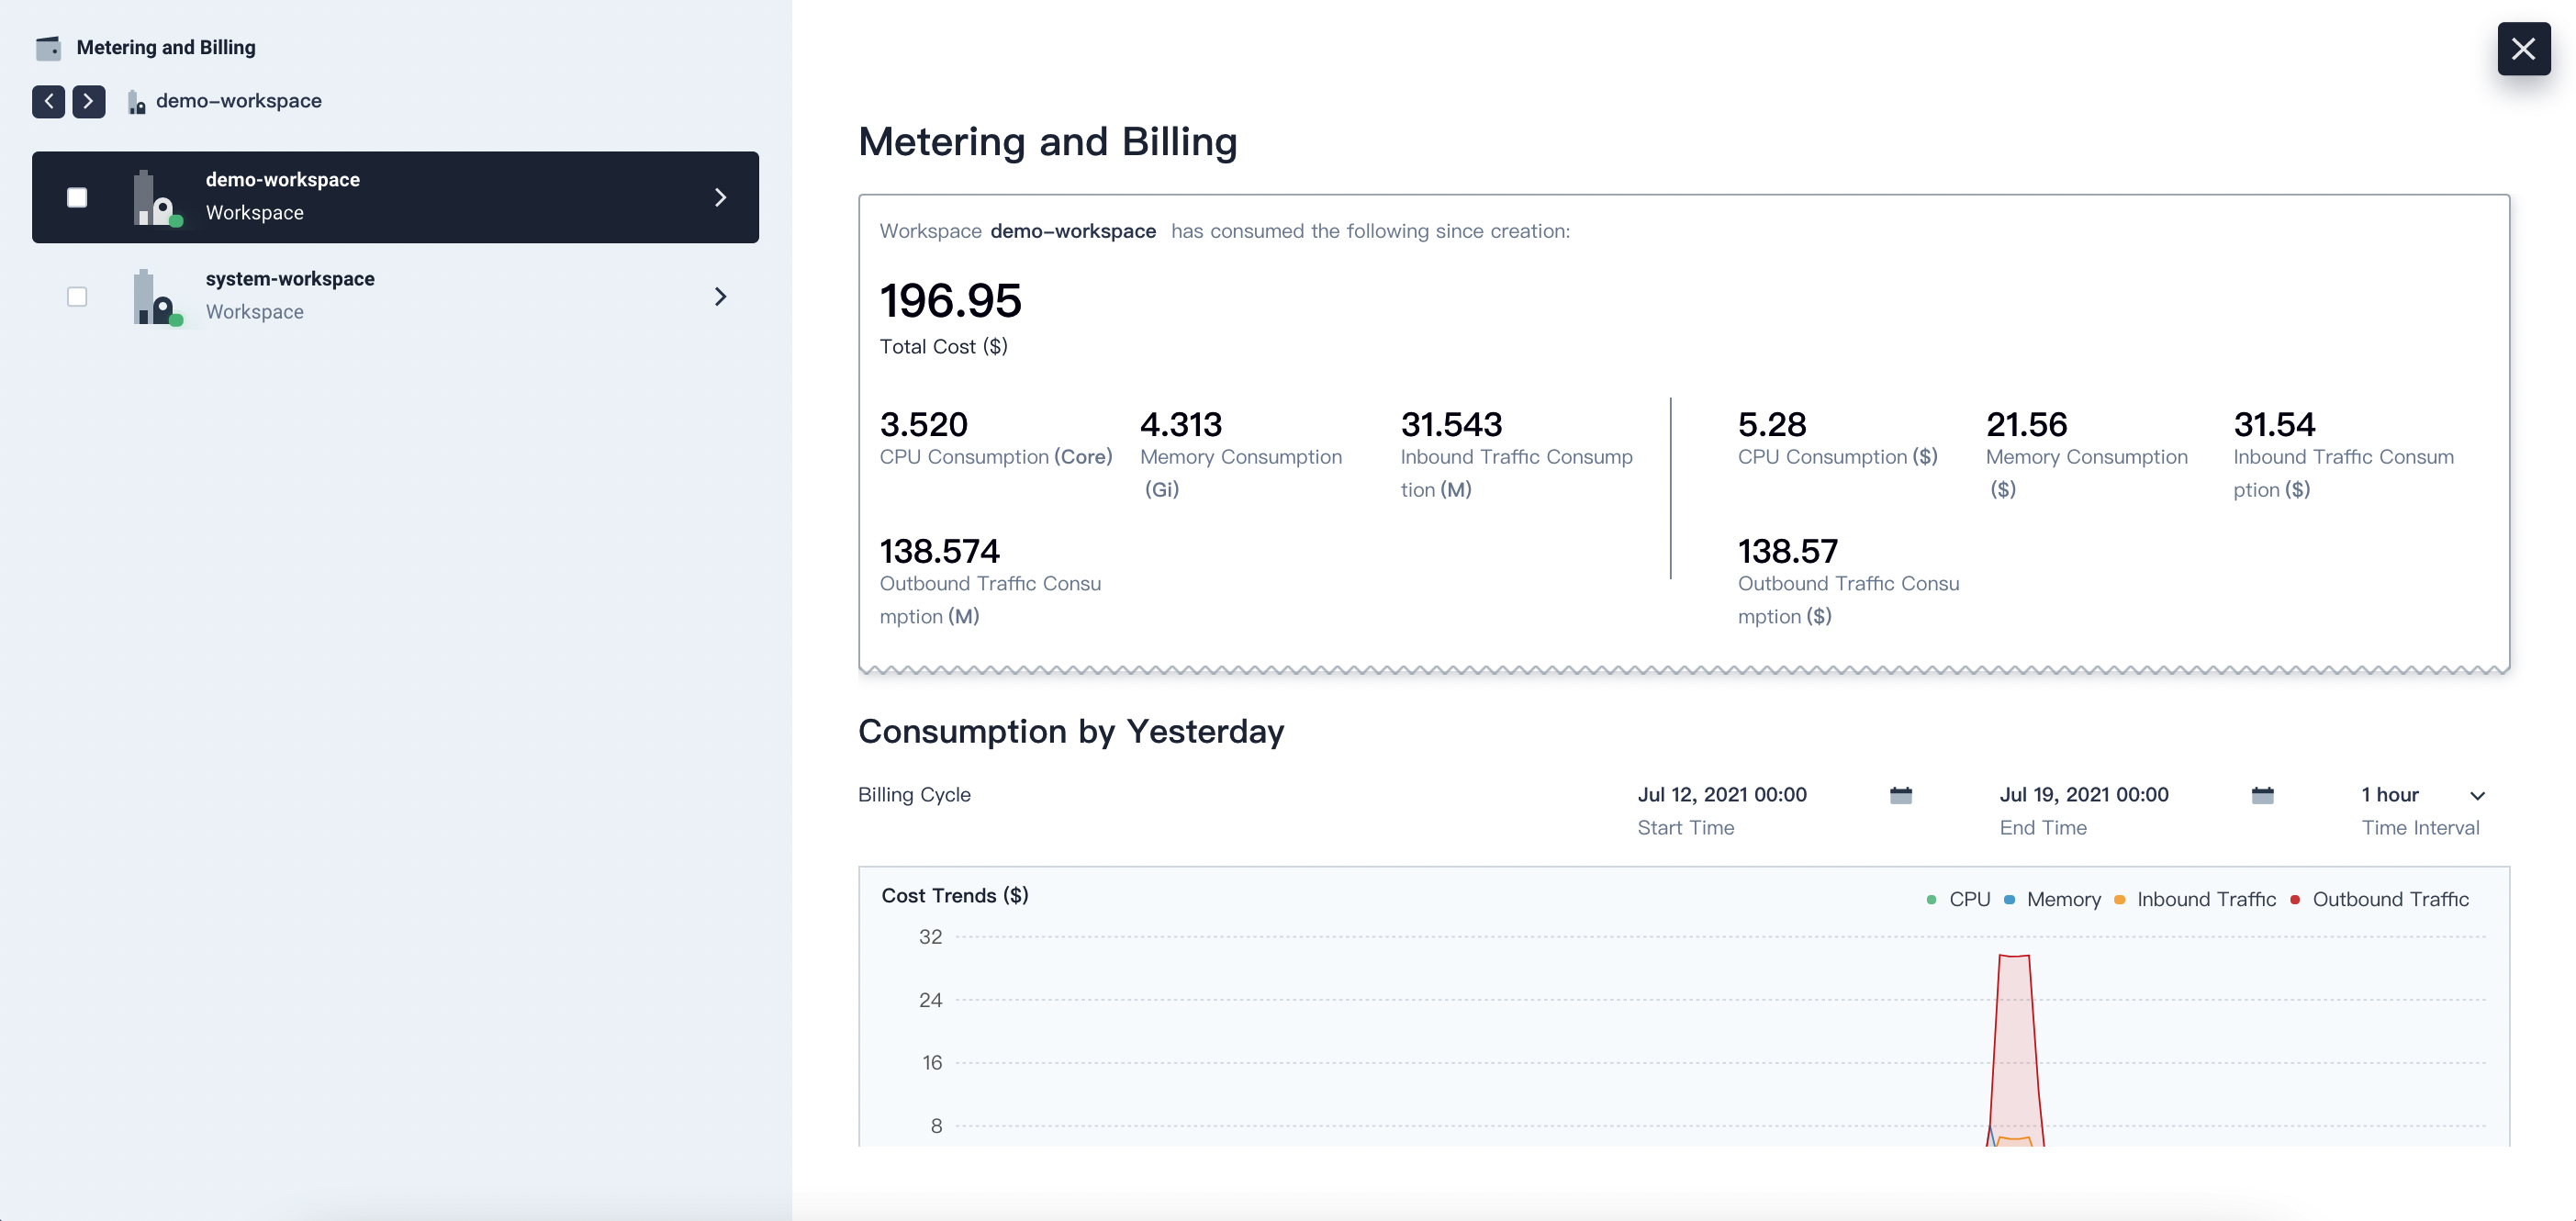
Note
In a multi-cluster architecture, you cannot see the metering and billing information of a workspace if it does not have any available cluster assigned to it. For more information, see Cluster Visibility and Authorization. -
Click a workspace on the left and dive deeper into a project or workload (for example, Deployment and StatefulSet) to see detailed consumption information.
Feedback
Was this page Helpful?
Thanks for the feedback. If you have a specific question about how to use KubeSphere, ask it on Slack. Open an issue in the GitHub repo if you want to report a problem or suggest an improvement.


 Previous
