


Add Elasticsearch as a Receiver
You can use Elasticsearch, Kafka and Fluentd as log receivers in KubeSphere. This tutorial demonstrates how to add an Elasticsearch receiver.
Prerequisites
-
You need an account granted a role including the permission of Cluster Management. For example, you can log in to the console as
admindirectly or create a new role with the permission and assign it to an account. -
Before adding a log receiver, you need to enable any of the
logging,eventsorauditingcomponents. For more information, see Enable Pluggable Components.loggingis enabled as an example in this tutorial.
Add Elasticsearch as a Receiver
-
Log in to KubeSphere as
admin. Click Platform in the top-left corner and select Cluster Management.Note
If you have enabled the multi-cluster feature, you can select a specific cluster. -
On the Cluster Management page, go to Log Collection in Cluster Settings.
-
Click Add Log Receiver and choose Elasticsearch.
-
Provide the Elasticsearch service address and port as below:
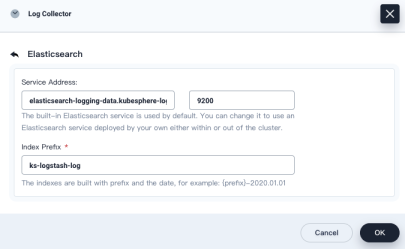
-
Elasticsearch will appear in the receiver list on the Log Collection page, the status of which is Collecting.
-
To verify whether Elasticsearch is receiving logs sent from Fluent Bit, click Log Search in the Toolbox in the bottom-right corner and search logs on the console. For more information, read Log Query.
Feedback
Was this page Helpful?
Thanks for the feedback. If you have a specific question about how to use KubeSphere, ask it on Slack. Open an issue in the GitHub repo if you want to report a problem or suggest an improvement.
 Previous

What’s on this Page