Alerting Policies (Workload Level)
KubeSphere provides alerting policies for nodes and workloads. This tutorial demonstrates how to create alerting policies for workloads in a project. See Alerting Policy (Node Level) to learn how to configure alerting policies for nodes.
Prerequisites
- You have enabled KubeSphere Alerting.
- To receive alert notifications, you must configure a notification channel beforehand.
- You need to create a workspace, a project and an account (
project-regular). The account must be invited to the project with the role ofoperator. For more information, see Create Workspaces, Projects, Accounts and Roles. - You have workloads in this project. If they are not ready, see Deploy and Access Bookinfo to create a sample app.
Create an Alerting Policy
-
Log in to the console as
project-regularand go to your project. Navigate to Alerting Policies under Monitoring & Alerting, then click Create. -
In the dialog that appears, provide the basic information as follows. Click Next to continue.
- Name. A concise and clear name as its unique identifier, such as
alert-demo. - Alias. Help you distinguish alerting policies better.
- Description. A brief introduction to the alerting policy.
- Duration (Minutes). An alert will be firing when the conditions defined for an alerting policy are met at any given point in the time range.
- Severity. Allowed values include Warning, Error and Critical, providing an indication of how serious an alert is.
- Name. A concise and clear name as its unique identifier, such as
-
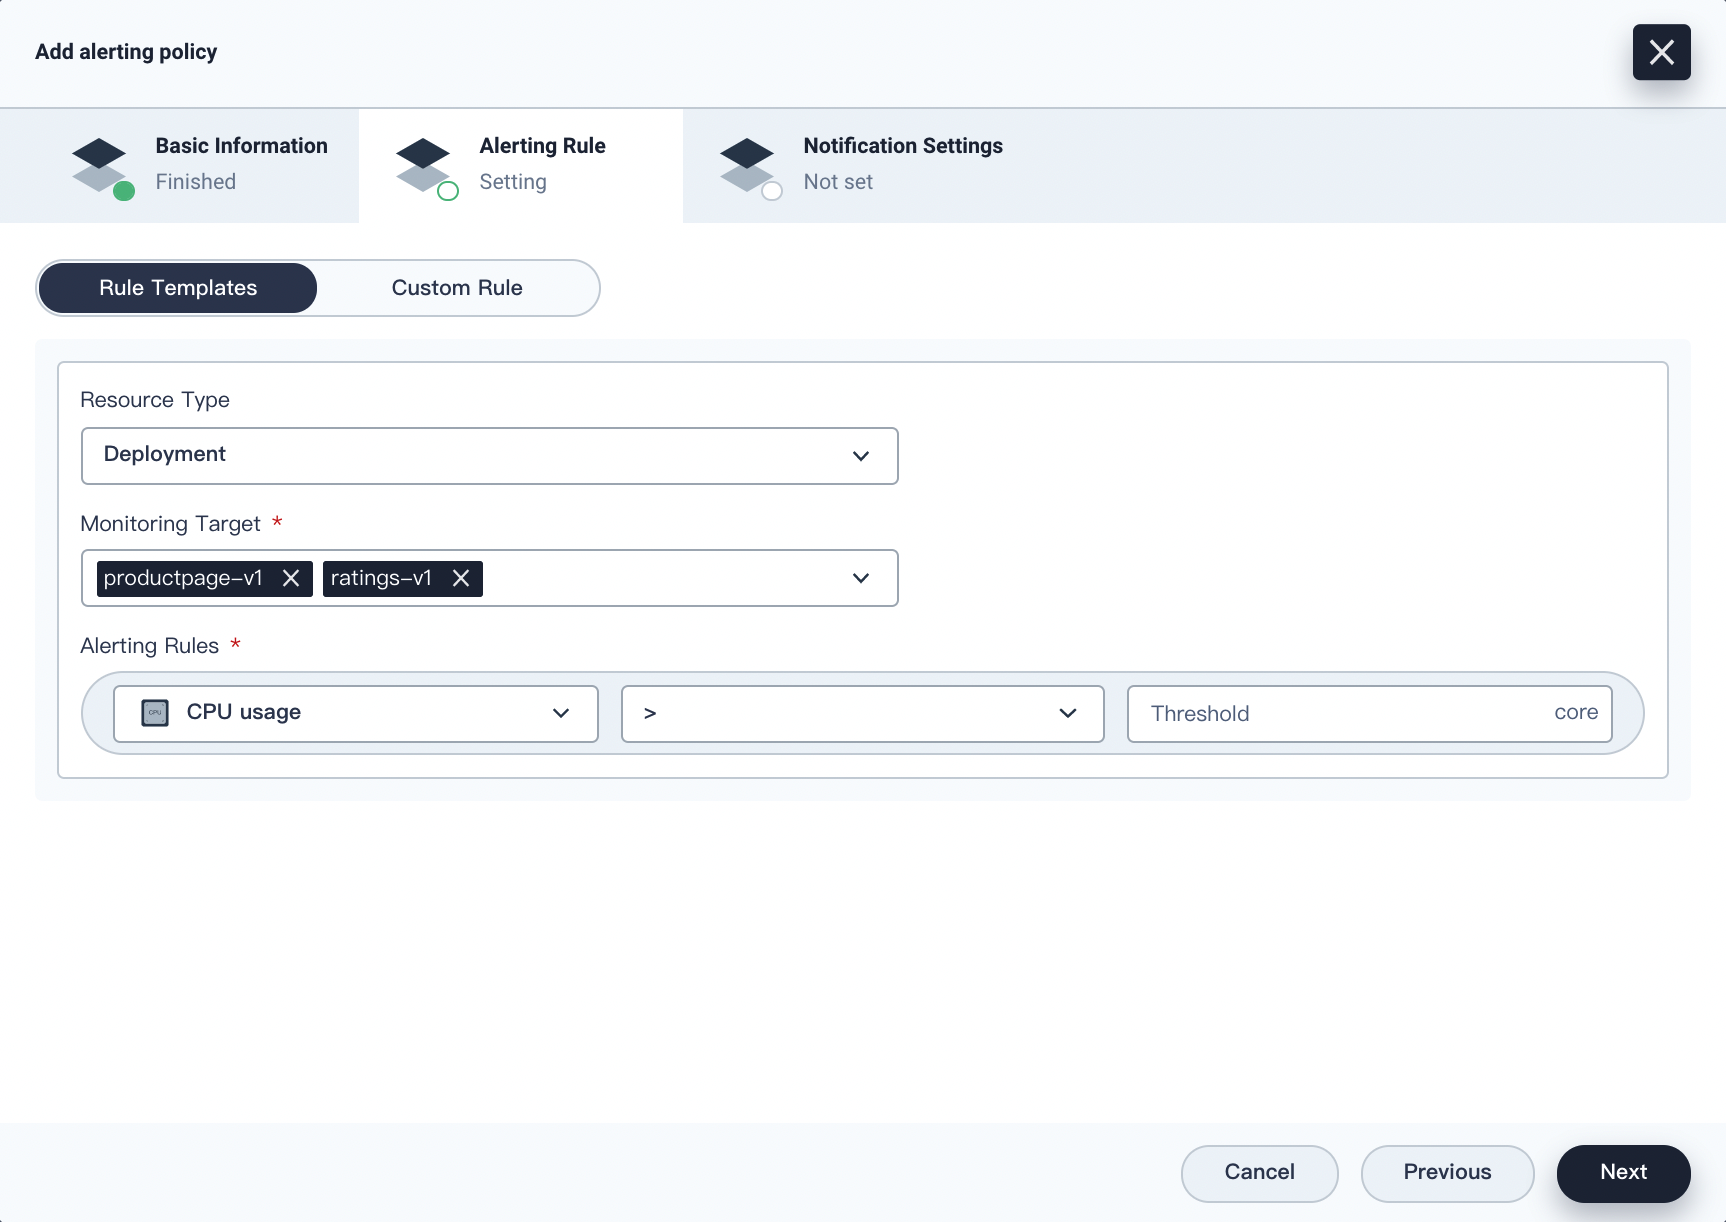
On the Alerting Rule tab, you can use the rule template or create a custom rule. To use the template, fill in the following fields.
- Resource Type. Select the resource type you want to monitor, such as Deployment, StatefulSet and DaemonSet.
- Monitoring Target. Depending on the resource type you select, the target can be different. You cannot see any target if you do not have any workload in the project.
- Alerting Rules. Define a rule for the alerting policy. These rules are based on Prometheus expressions and an alert will be triggered when conditions are met. You can monitor objects such as CPU and memory.

Note
You can create a custom rule with PromQL by entering an expression in the Monitoring Metrics field (autocompletion supported). For more information, see Querying Prometheus.Click Next to continue.
-
On the Notification Settings tab, enter the alert summary and message to be included in your notification, then click Create.
-
An alerting policy will be Inactive when just created. If conditions in the rule expression are met, it will reach Pending first, then turn to Firing if conditions keep to be met in the given time range.
Edit an Alerting Policy
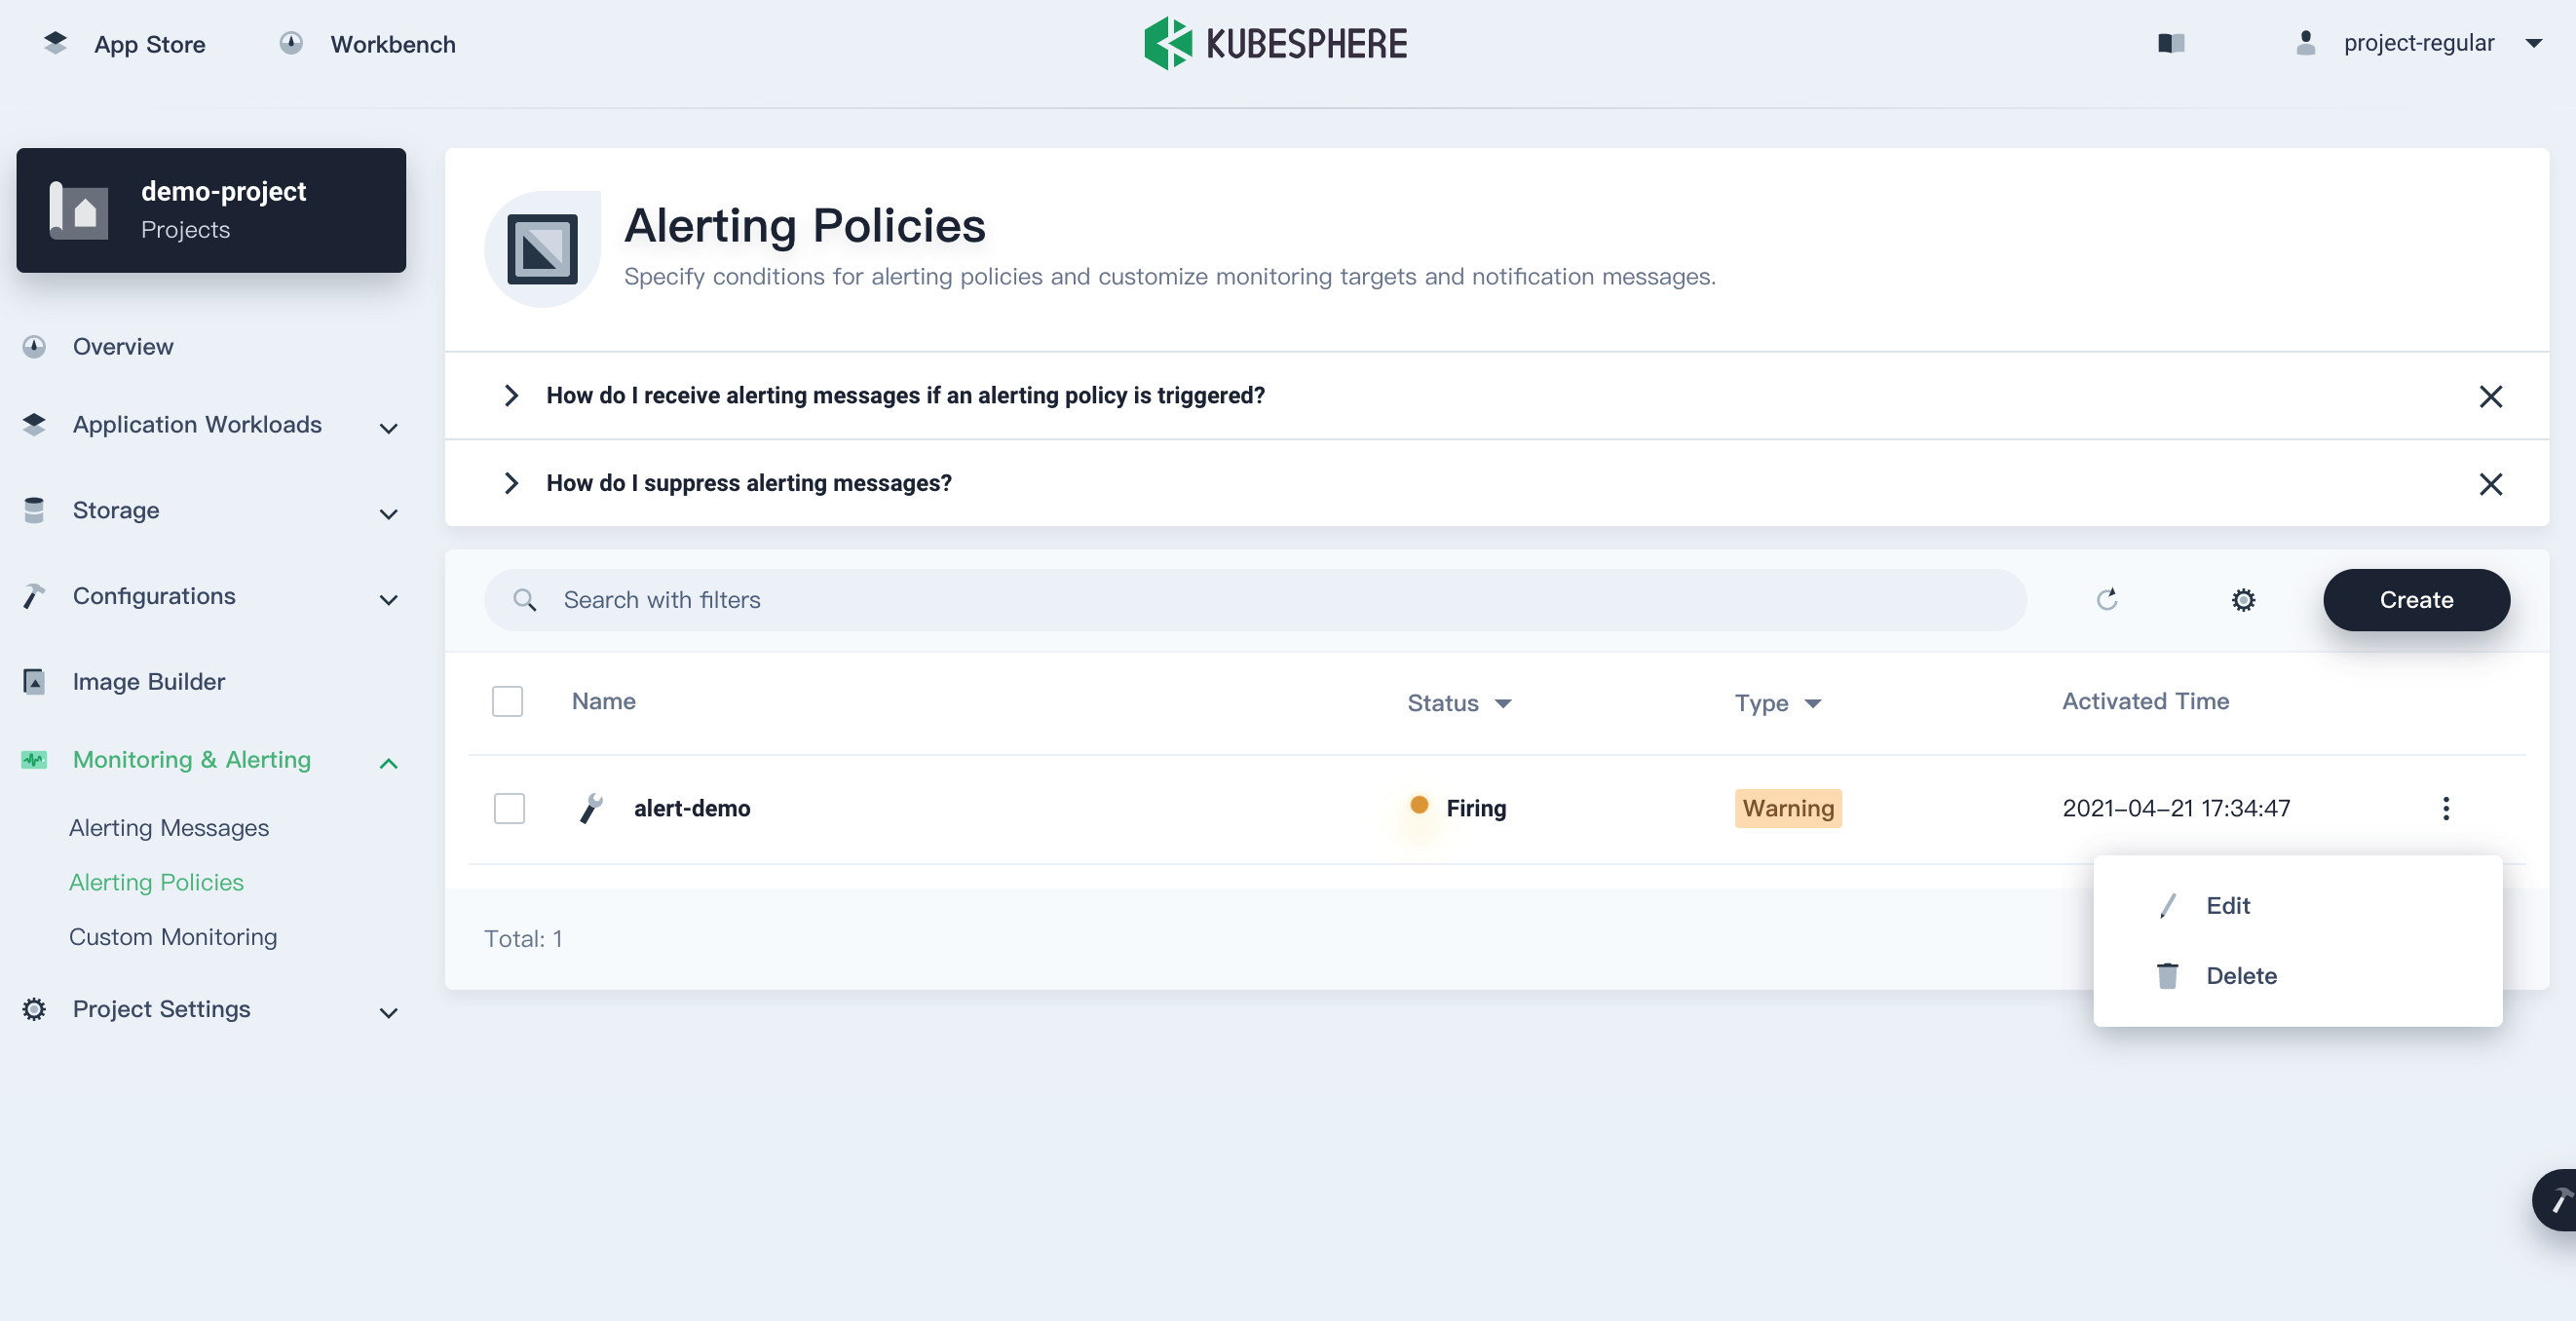
To edit an alerting policy after it is created, on the Alerting Policies page, click  on the right.
-
Click Edit from the drop-down menu and edit the alerting policy following the same steps as you create it. Click Update on the Notification Settings page to save it.

-
Click Delete from the drop-down menu to delete an alerting policy.
View an Alerting Policy
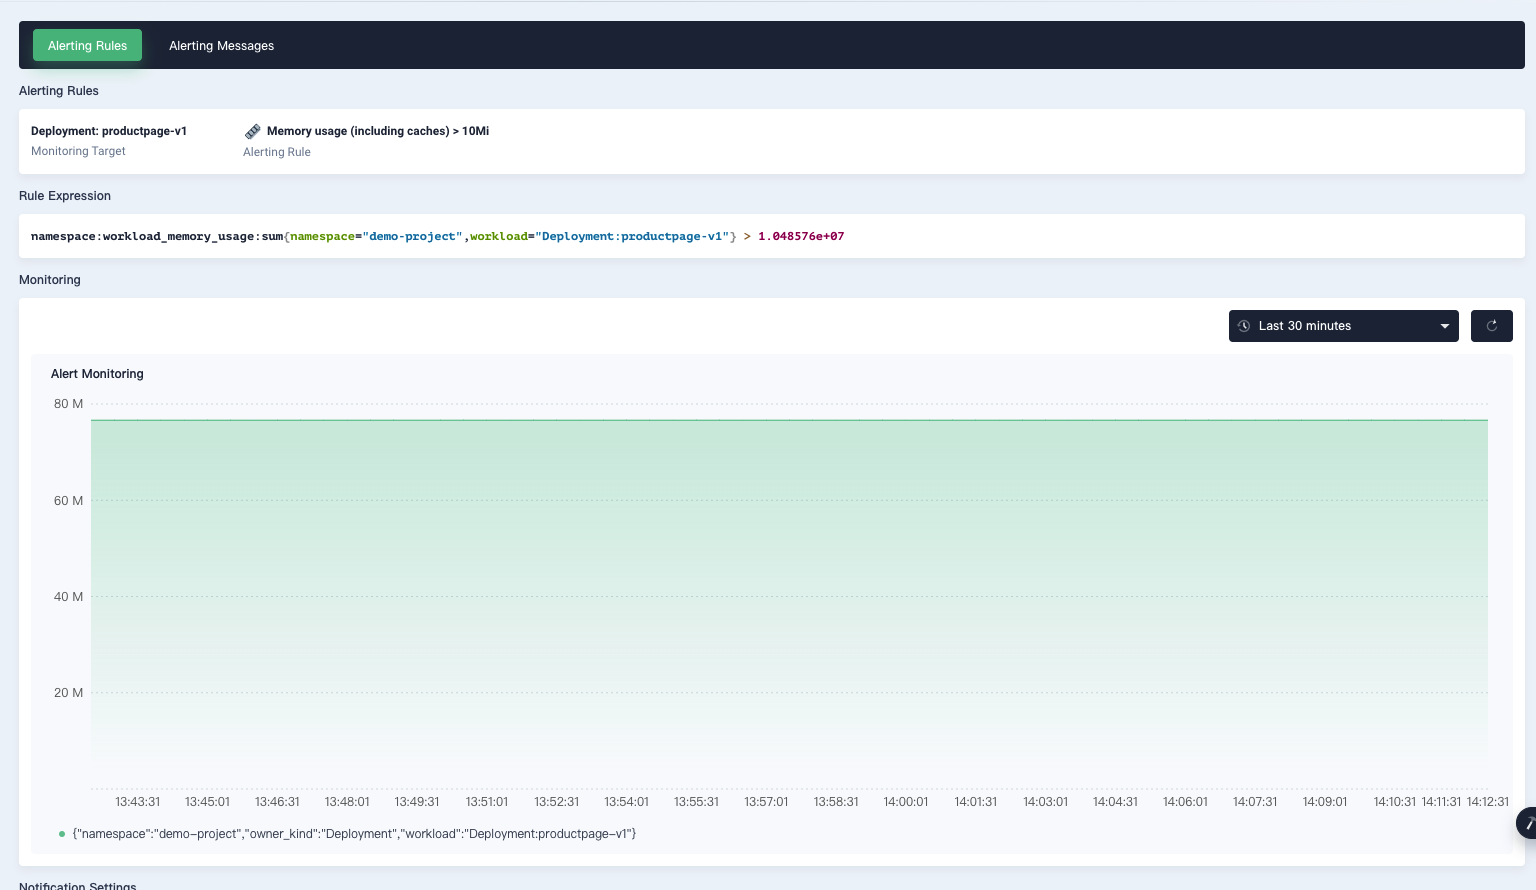
Click an alerting policy on the Alerting Policies page to see its detail information, including alerting rules and alerting messages. You can also see the rule expression which is based on the template you use when creating the alerting policy.
Under Monitoring, the Alert Monitoring chart shows the actual usage or amount of resources over time. Notification Settings displays the customized message you set in notifications.

Feedback
Was this page Helpful?
Thanks for the feedback. If you have a specific question about how to use KubeSphere, ask it on Slack. Open an issue in the GitHub repo if you want to report a problem or suggest an improvement.


 Previous
