


Monitor MySQL
From the Introduction section, you know it is not feasible to instrument MySQL with Prometheus metrics directly. To expose MySQL metrics in Prometheus format, you need to deploy MySQL Exporter first.
This tutorial demonstrates how to monitor and visualize MySQL metrics.
Prerequisites
- You need to enable the App Store. MySQL and MySQL Exporter will be deployed from the App Store.
- You need to create a workspace, a project, and an account (
project-regular) for this tutorial. The account needs to be invited to the project with theoperatorrole. For more information, see Create Workspaces, Projects, Accounts and Roles.
Step 1: Deploy MySQL
To begin with, you need to deploy MySQL from the App Store.
-
Go to your project and click App Store in the top-left corner.
-
Click MySQL to go to its product detail page and click Deploy on the App Information tab.
Note
MySQL is a built-in app in the KubeSphere App Store, which means it can be deployed and used directly once the App Store is enabled. -
Under Basic Information, set an App Name and select an App Version. Select the project where the app will be deployed under Deployment Location and click Next.
-
Under App Configurations, set a root password by uncommenting the
mysqlRootPasswordfield and click Deploy.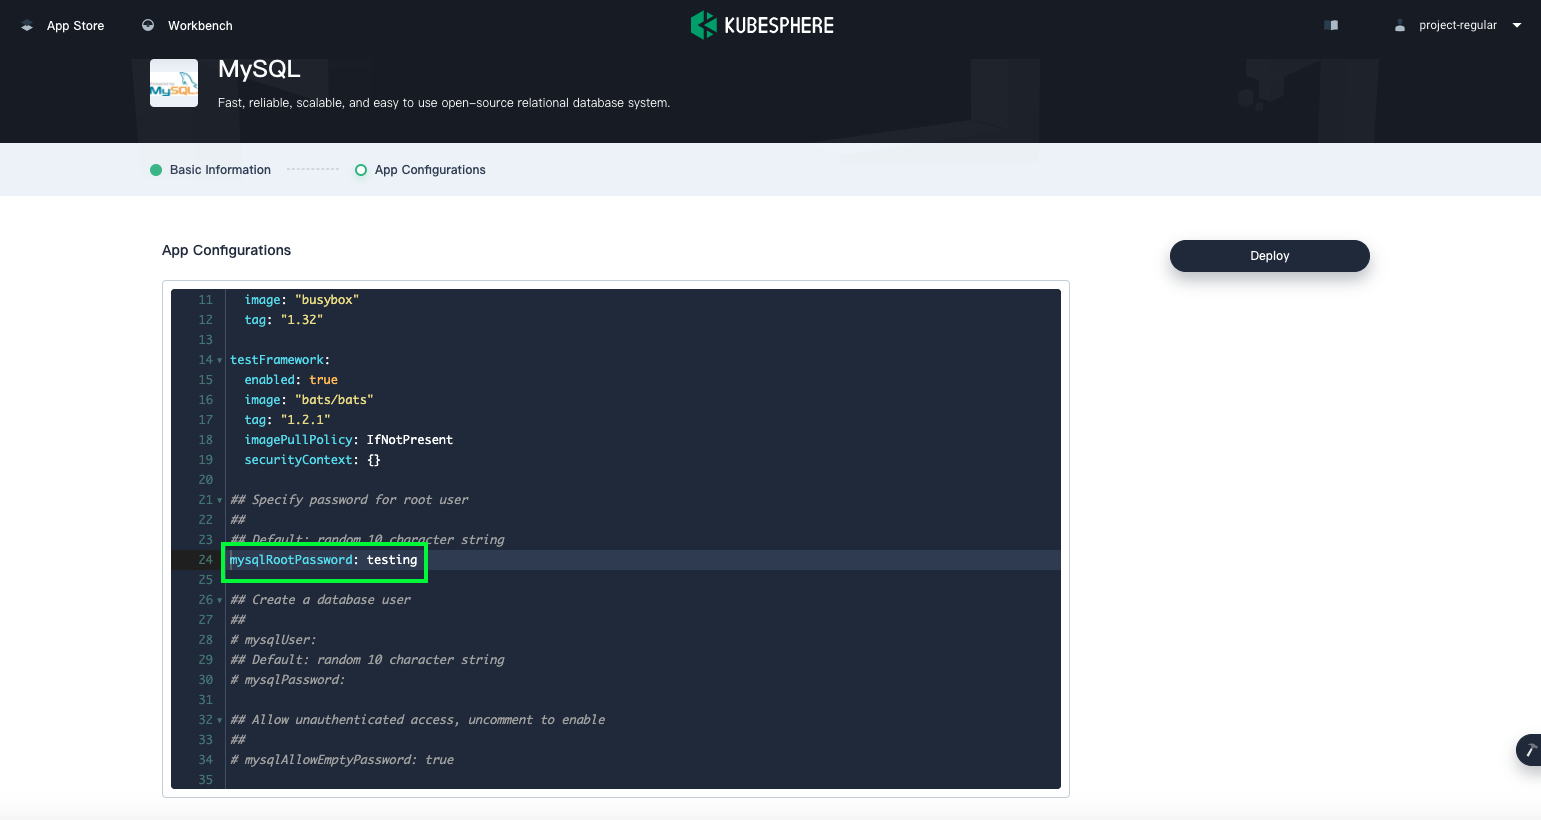
-
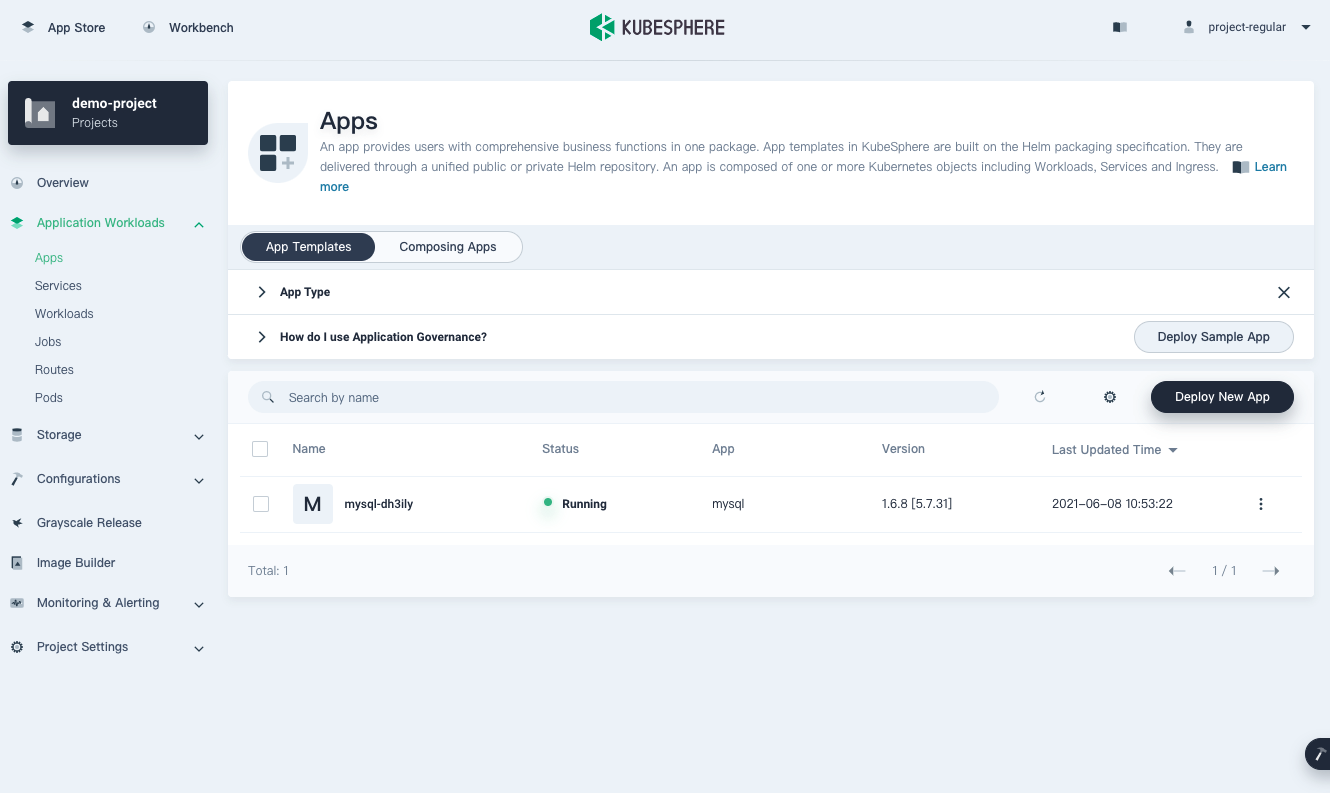
Wait until MySQL is up and running.
Step 2: Deploy MySQL Exporter
You need to deploy MySQL Exporter in the same project on the same cluster. MySQL Exporter is responsible for querying the status of MySQL and reports the data in Prometheus format.
-
Go to App Store and click MySQL Exporter.
-
On the product detail page, click Deploy.
-
Under Basic Information, set an App Name and select an App Version. Select the same project where MySQL is deployed under Deployment Location and click Next.
-
Make sure
serviceMonitor.enabledis set totrue. The built-in MySQL Exporter sets it totrueby default, so you don’t need to manually change the value ofserviceMonitor.enabled.Warning
You must enable the ServiceMonitor CRD if you are using external exporter Helm charts. Those charts usually disable ServiceMonitors by default and require manual modification. -
Modify MySQL connection parameters. MySQL Exporter needs to connect to the target MySQL. In this tutorial, MySQL is installed with the service name
mysql-dh3ily. Navigate tomysqlin the configuration file, and sethosttomysql-dh3ily,passtotesting, andusertorootas below. Note that your MySQL service may be created with a different name.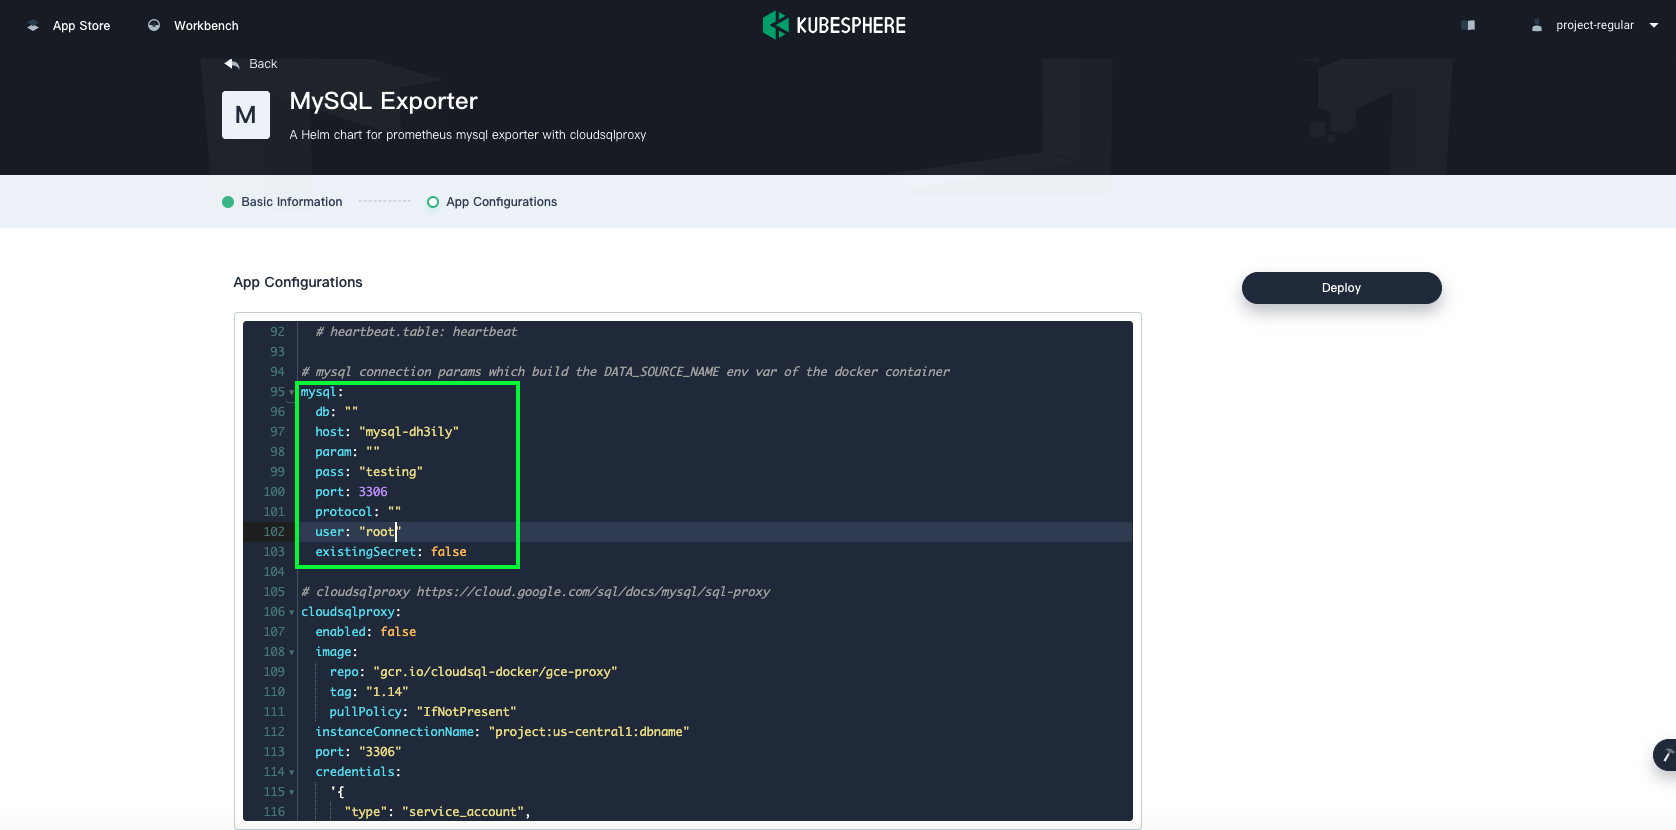
Click Deploy.
-
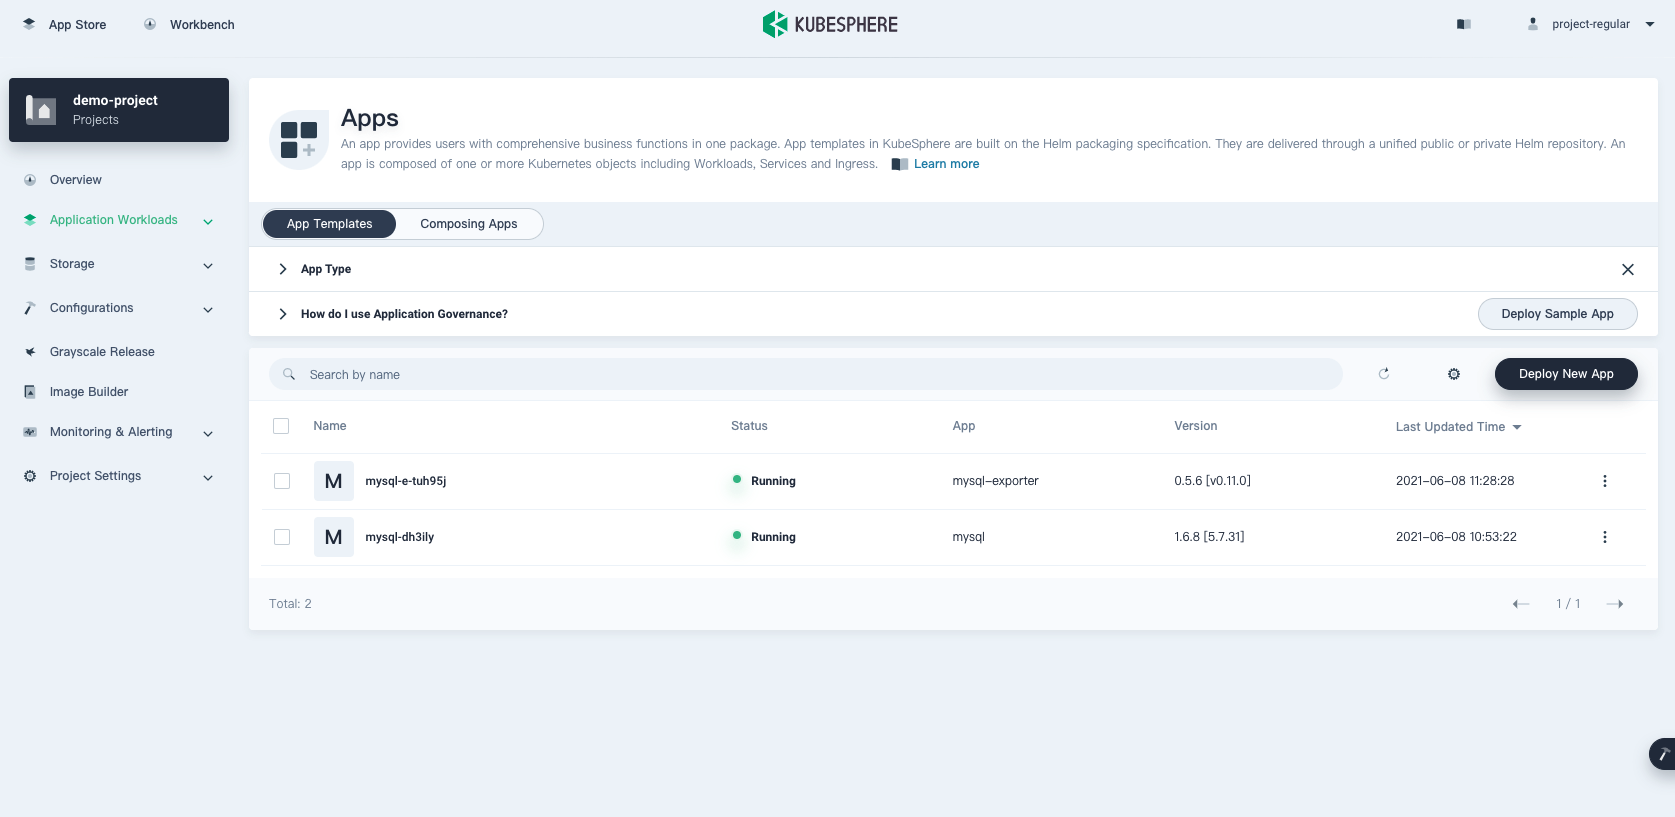
Wait until MySQL Exporter is up and running.
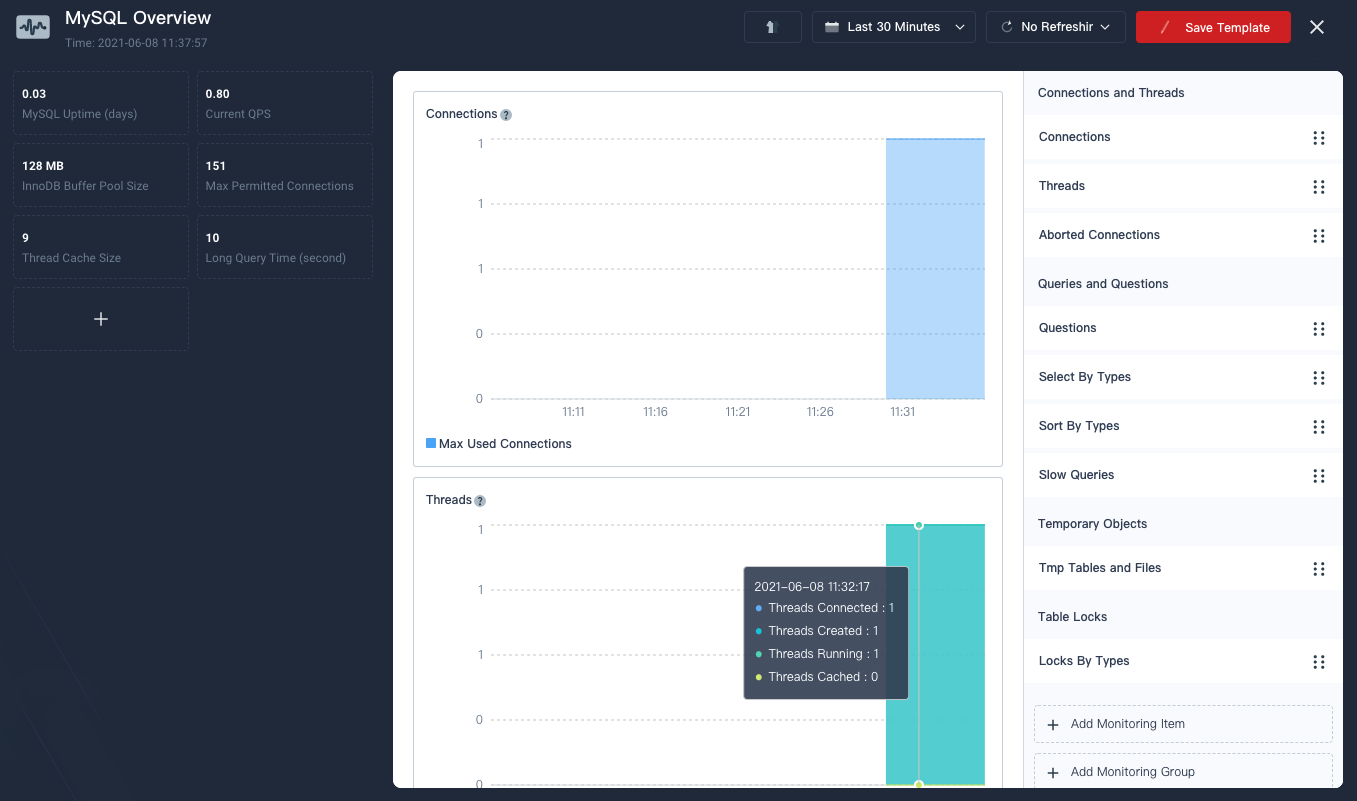
Step 3: Create a Monitoring Dashboard
You can create a monitoring dashboard for MySQL and visualize real-time metrics.
-
In the same project, go to Custom Monitoring under Monitoring & Alerting in the sidebar and click Create.
-
In the dialog that appears, set a name for the dashboard (for example,
mysql-overview) and select the MySQL template. Click Next to continue. -
Save the template by clicking Save Template in the top-right corner. A newly-created dashboard will appear on the Custom Monitoring Dashboards page.
Note
-
The built-in MySQL template is provided by KubeSphere to help you monitor MySQL metrics. You can also add more metrics on the dashboard as needed.
-
For more information about dashboard properties, see Visualization.
-
Feedback
Was this page Helpful?
Thanks for the feedback. If you have a specific question about how to use KubeSphere, ask it on Slack. Open an issue in the GitHub repo if you want to report a problem or suggest an improvement.
 Previous

What’s on this Page