
Monitor a Sample Web Application
This section walks you through monitoring a sample web application. The application is instrumented with Prometheus Go client in its code. Therefore, it can expose metrics directly without the help of exporters.
Prerequisites
-
Please make sure you enable the OpenPitrix system.
-
You need to create a workspace, a project, and a user account for this tutorial. For more information, see Create Workspaces, Projects, Accounts and Roles. The account needs to be a platform regular user and to be invited to the workspace with the
self-provisionerrole. Namely, create an accountworkspace-self-provisionerof theself-provisionerrole, and use this account to create a project (for example,test). In this tutorial, you log in asworkspace-self-provisionerand work in the projecttestin the workspacedemo-workspace. -
Knowledge of Helm charts and PromQL.
Hands-on Lab
Step 1: Prepare the image of a sample web application
The sample web application exposes a user-defined metric called myapp_processed_ops_total. It is a counter type metric that counts the number of operations that have been processed. The counter increases automatically by one every 2 seconds.
This sample application exposes application-specific metrics via the endpoint http://localhost:2112/metrics.
In this tutorial, you use the made-ready image kubespheredev/promethues-example-app. The source code can be found in kubesphere/prometheus-example-app. You can also follow Instrument A Go Application For Prometheus in the official documentation of Prometheus.
Step 2: Pack the application into a Helm chart
Pack the Deployment, Service, and ServiceMonitor YAML template into a Helm chart for reuse. In the Deployment and Service template, you define the sample web container and the port for the metrics endpoint. A ServiceMonitor is a custom resource defined and used by Prometheus Operator. It connects your application and KubeSphere monitoring engine (Prometheus) so that the engine knows where and how to scrape metrics. In future releases, KubeSphere will provide a graphical user interface for easy operation.
Find the source code in the folder helm in kubesphere/prometheus-example-app. The Helm chart package is made ready and is named prometheus-example-app-0.1.0.tgz. Please download the .tgz file and you will use it in the next step.
Step 3: Upload the Helm chart
-
Go to the workspace Overview page of
demo-workspaceand navigate to App Templates.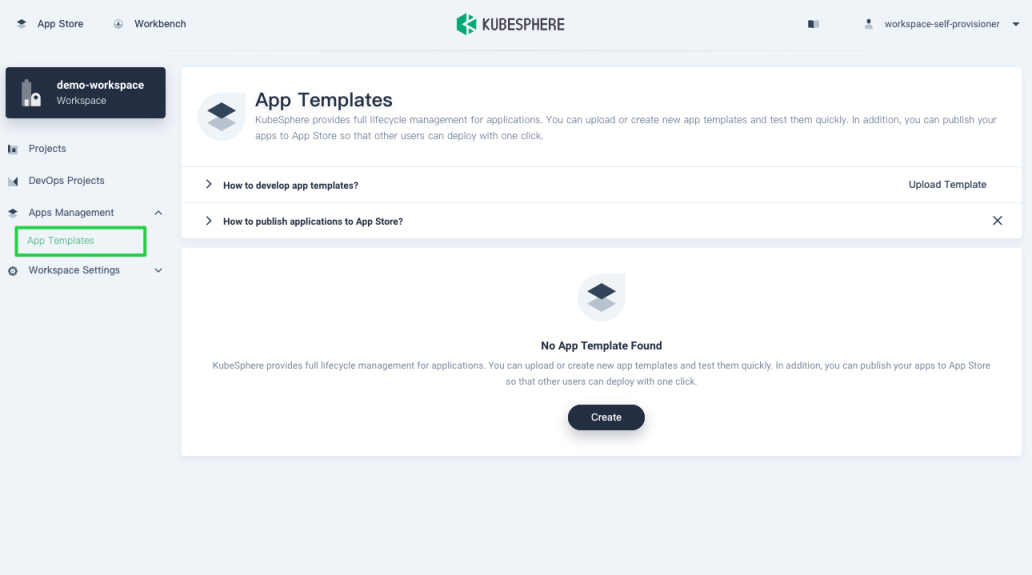
-
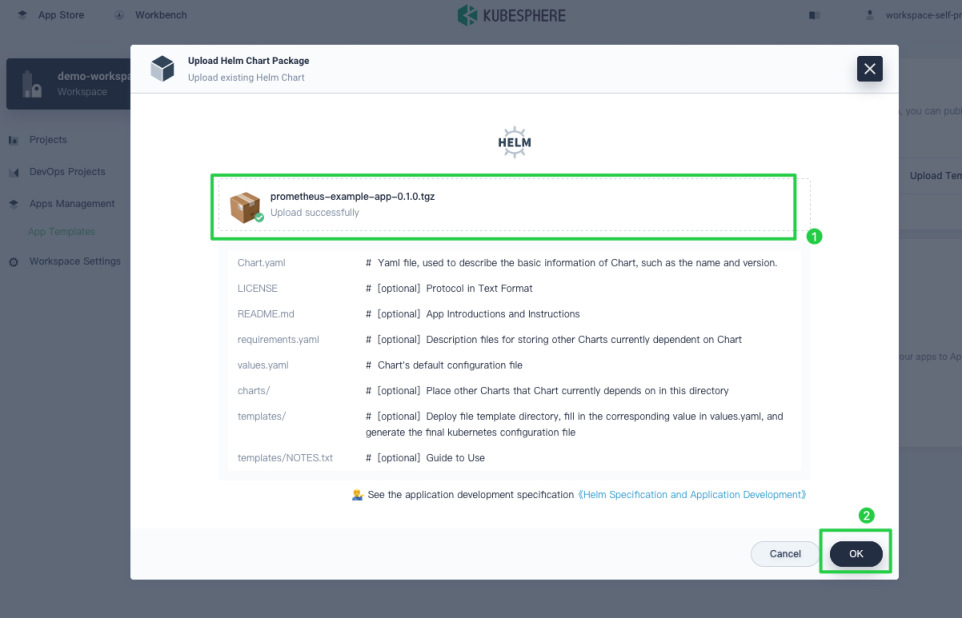
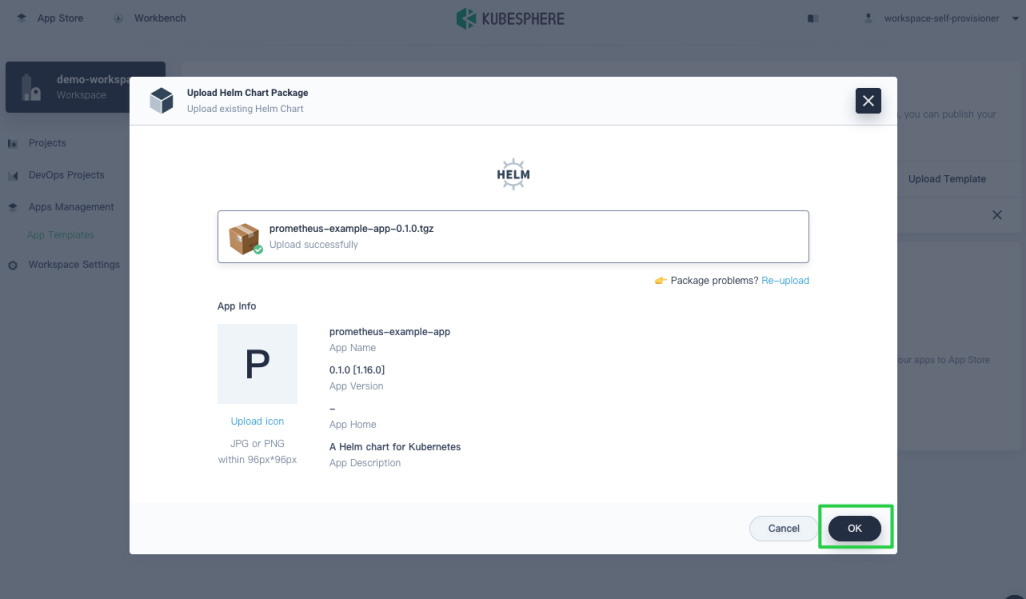
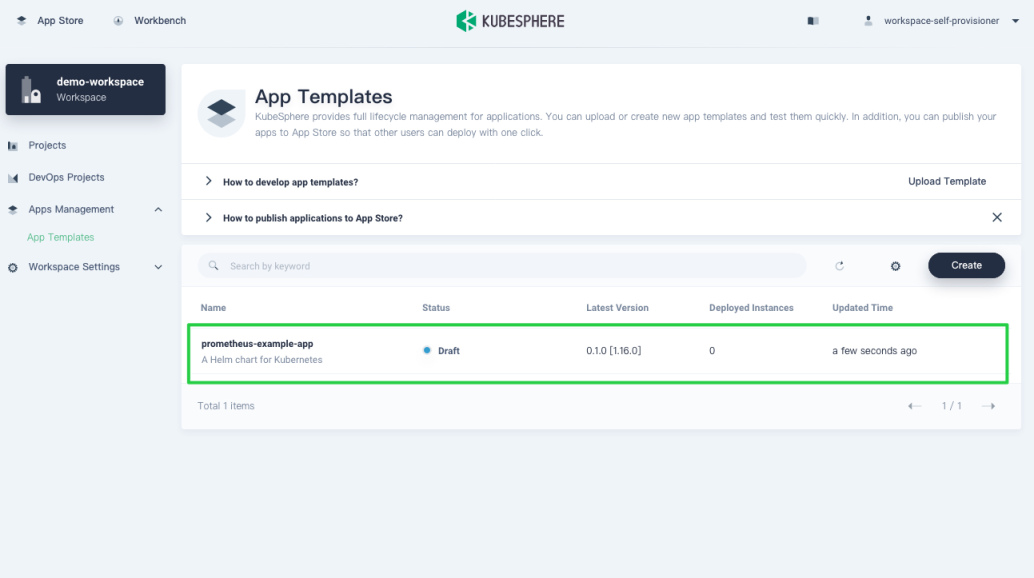
Click Create and upload
prometheus-example-app-0.1.0.tgzas images below.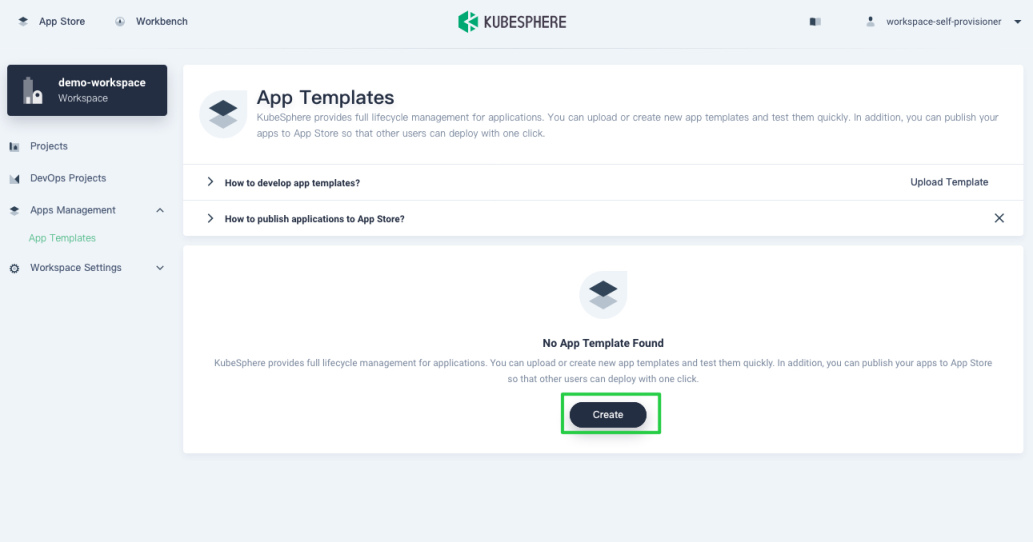
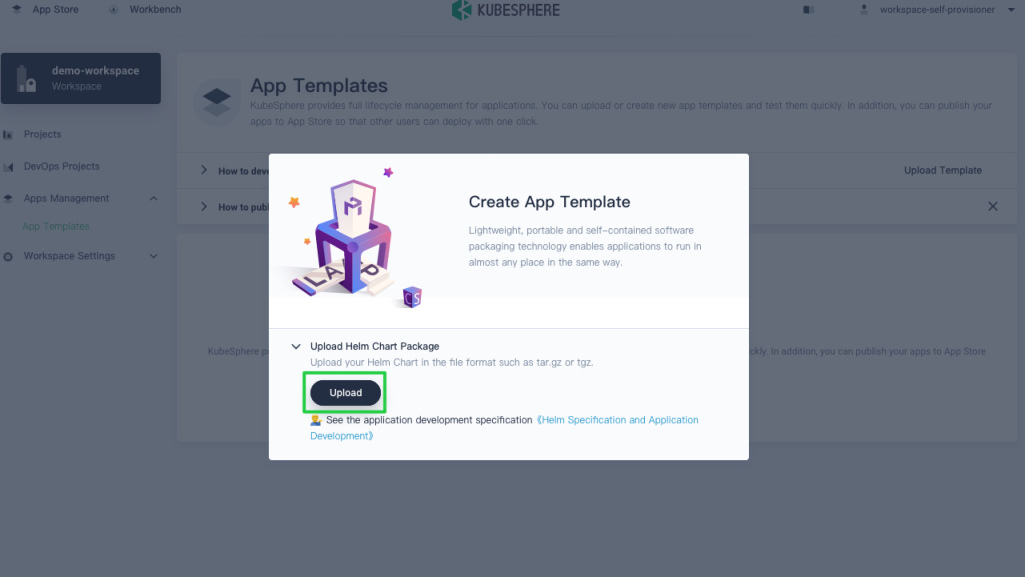
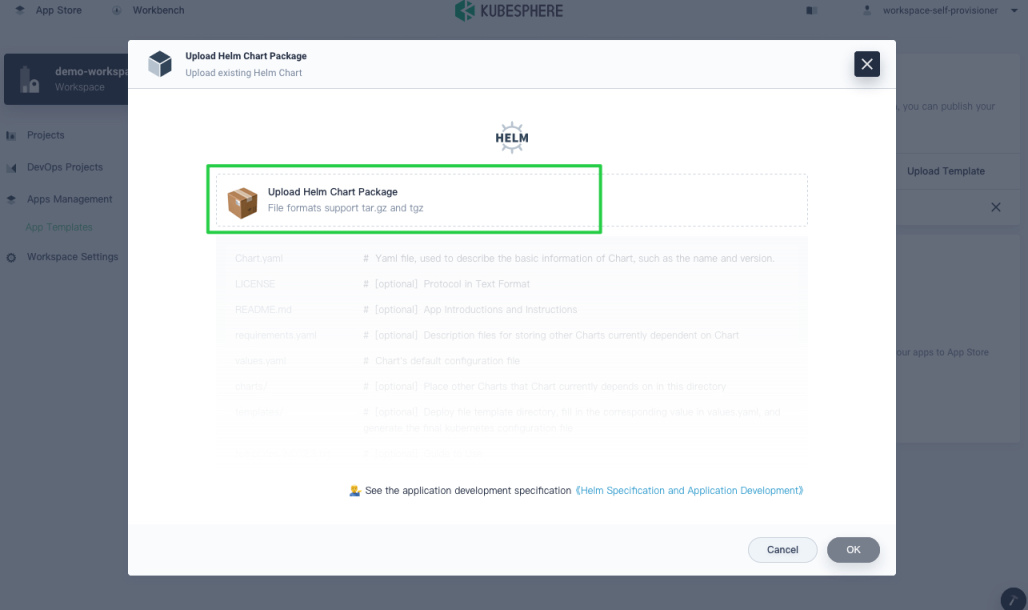
Step 4: Deploy the sample web application
You need to deploy the sample web application into test. For demonstration purposes, you can simply run a test deployment.
-
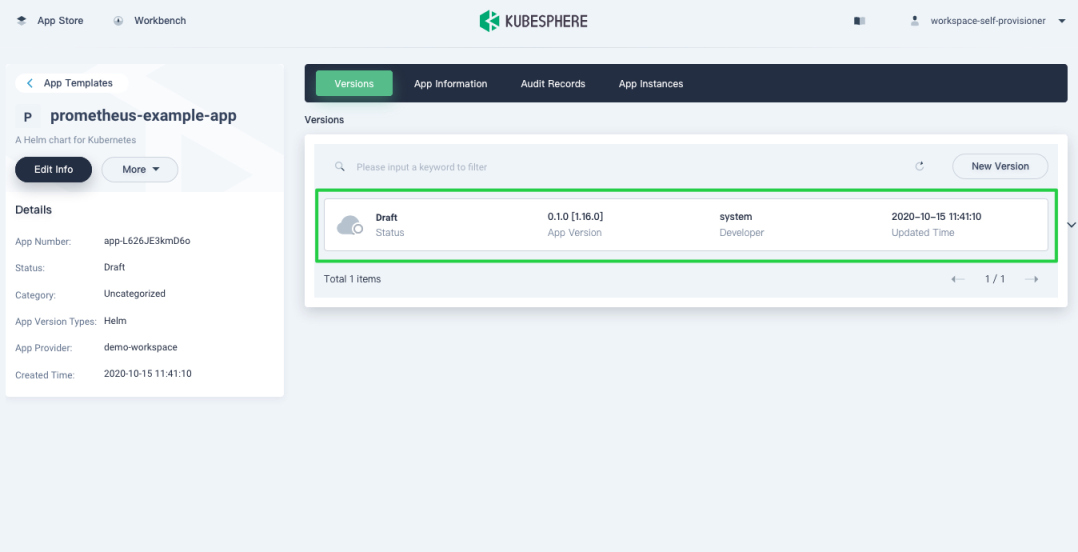
Click
prometheus-example-app.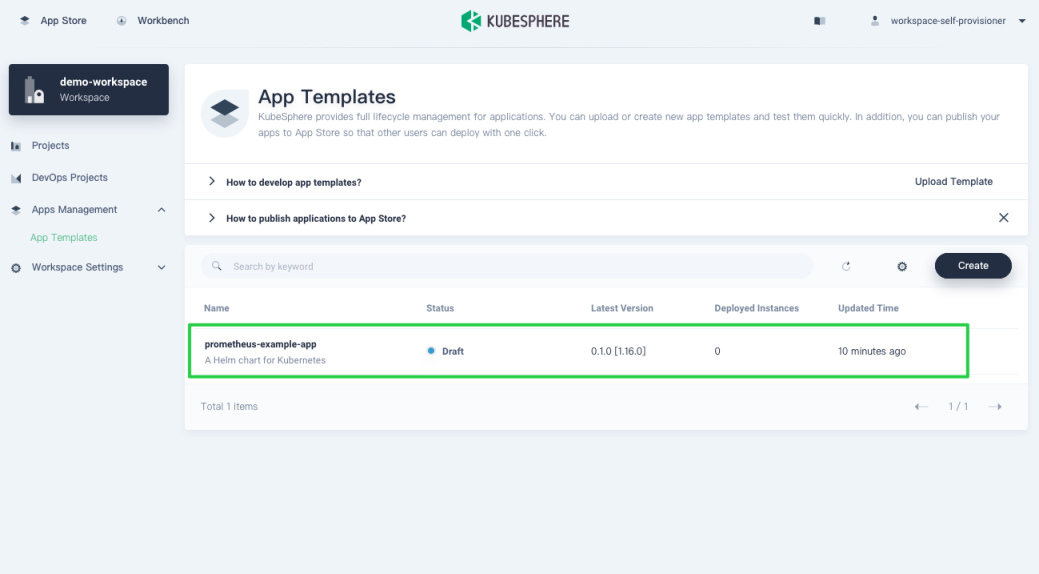
-
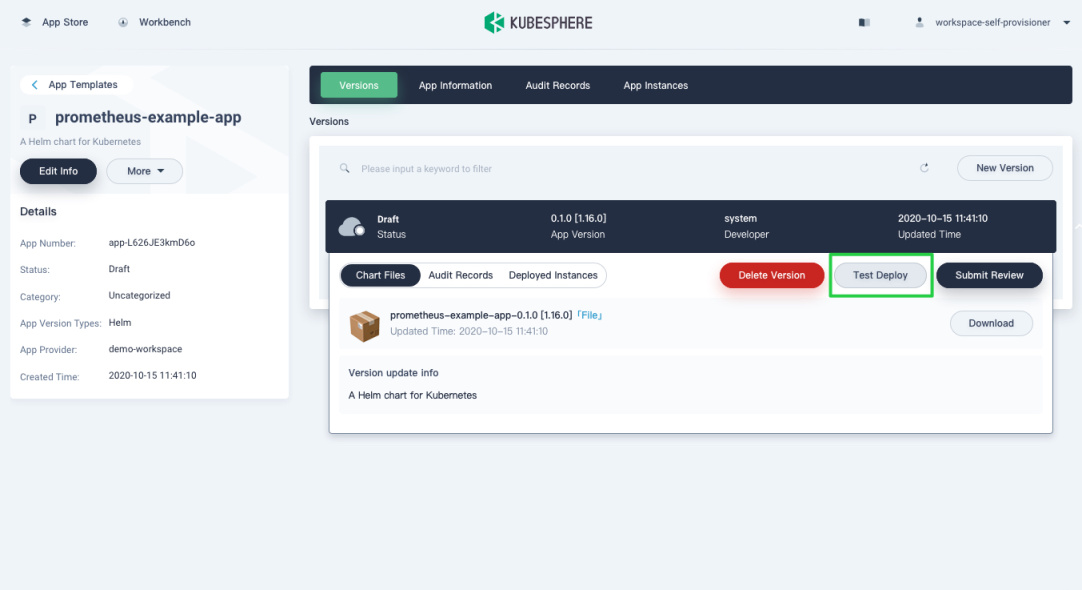
Expand the menu and click Test Deployment.
-
Make sure you deploy the sample web application in
testand click Next.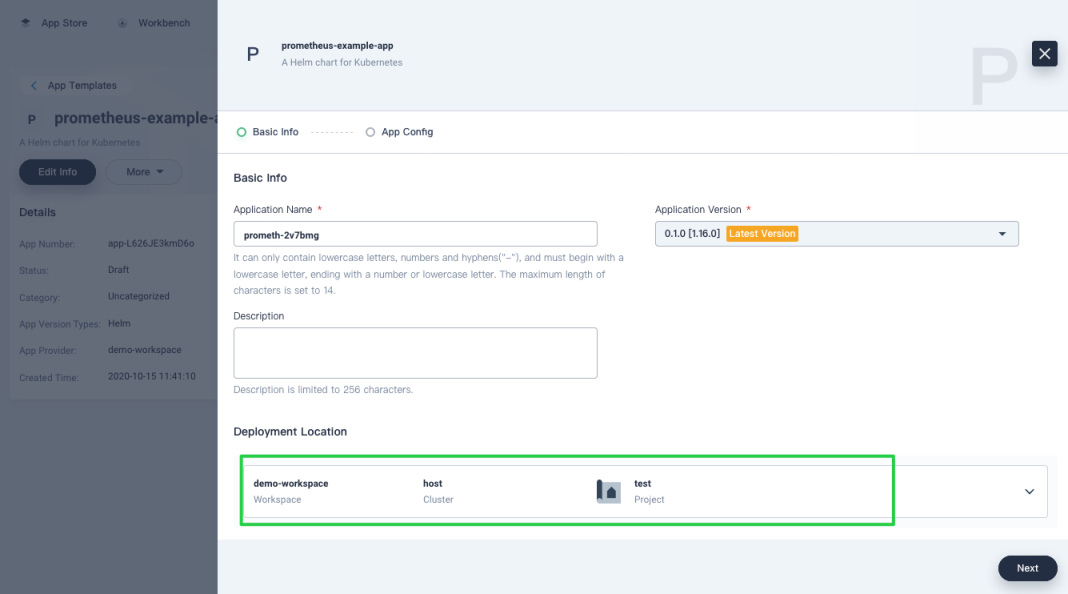
-
Make sure
serviceMonitor.enabledis set totrueand click Deploy.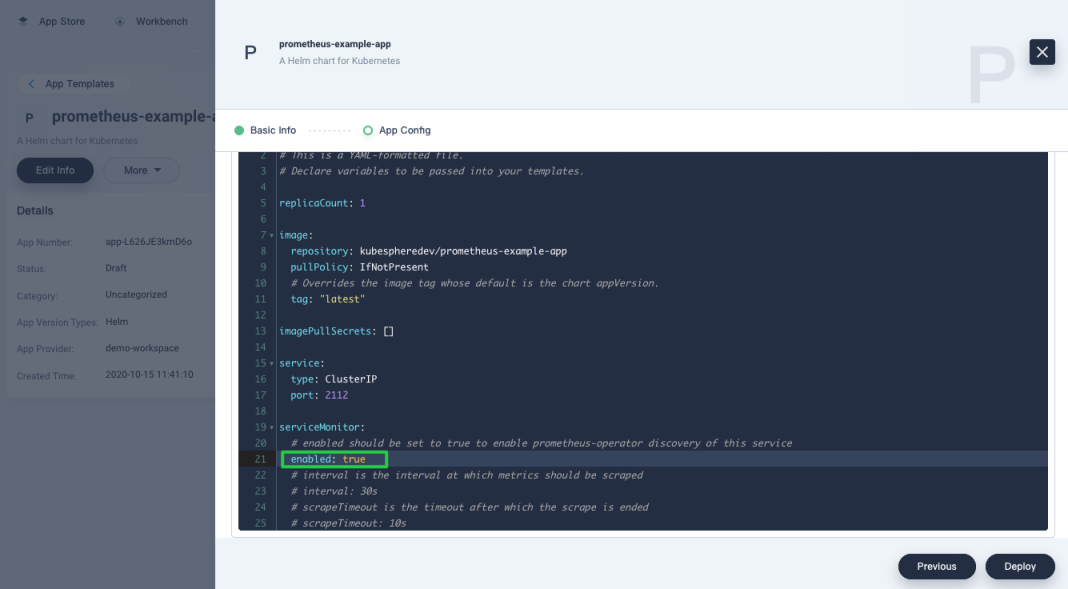
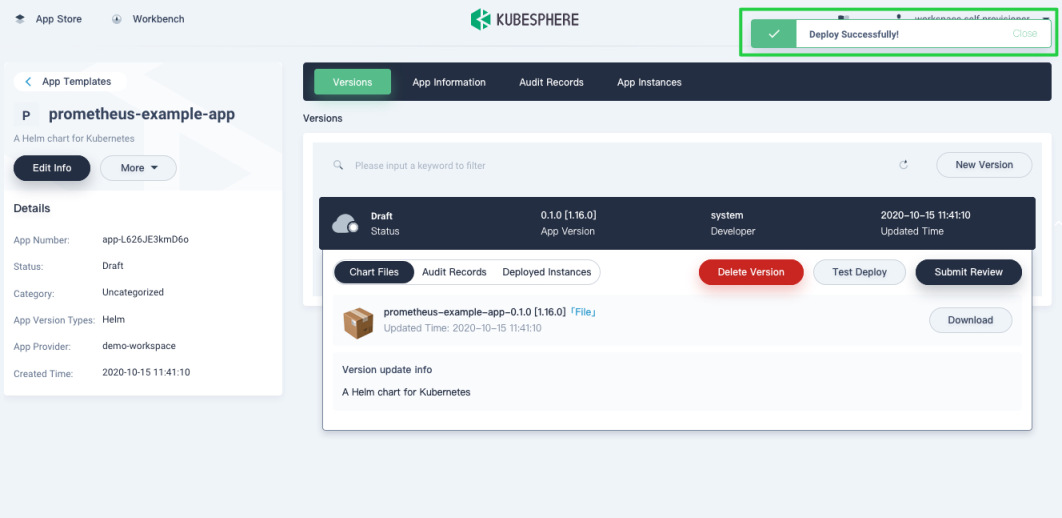
-
In Workloads of the project
test, wait until the sample web application is up and running.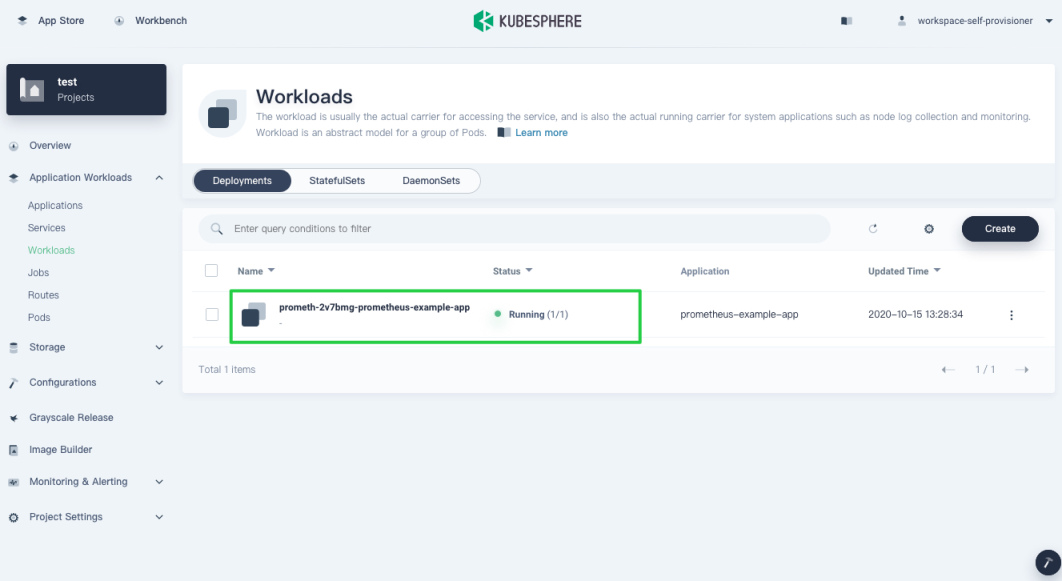
Step 5: Create a monitoring dashboard
This section guides you on how to create a dashboard from scratch. You will create a text chart showing the total number of processed operations and a line chart for displaying the operation rate.
-
Navigate to Custom Monitoring and click Create.
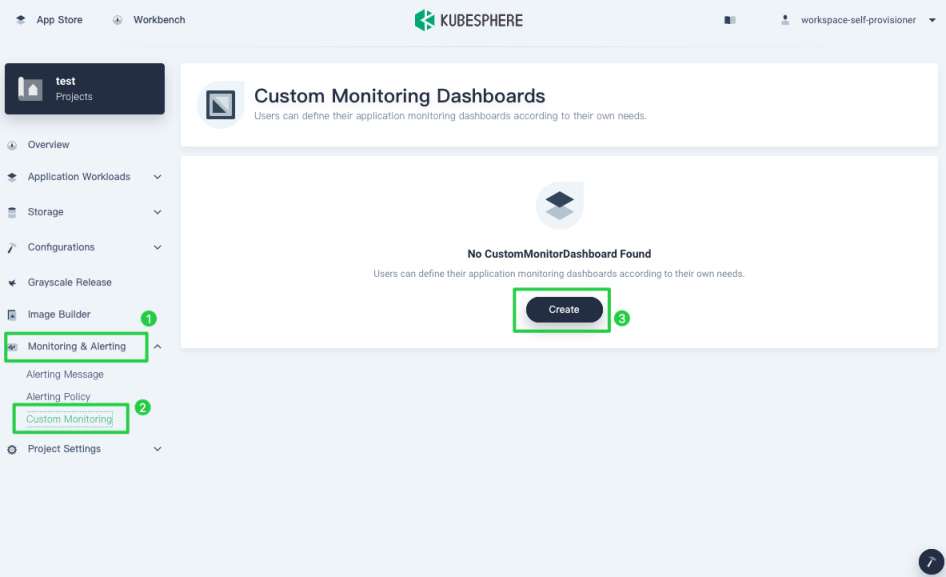
-
Set a name (for example,
sample-web) and click Create.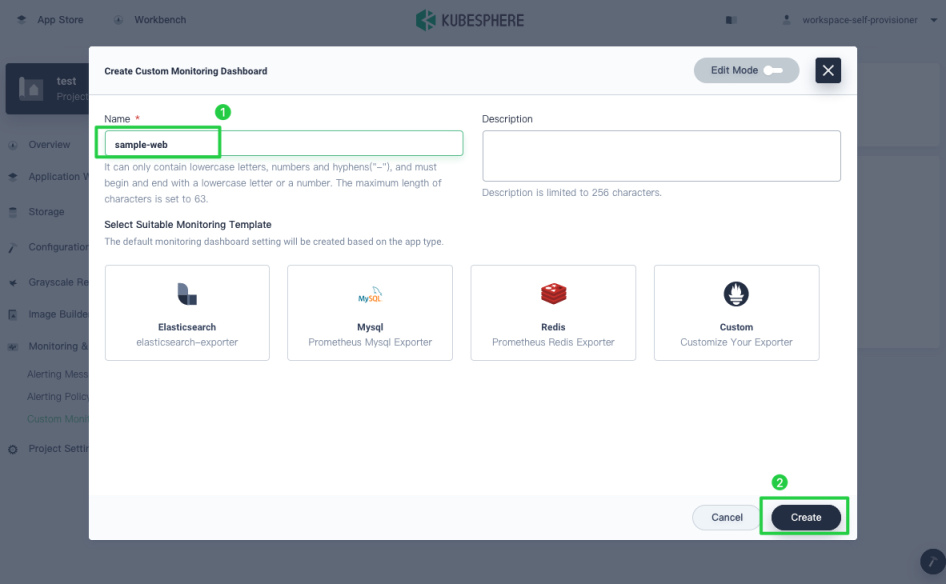
-
Enter a title in the top-left corner (for example,
Sample Web Overview).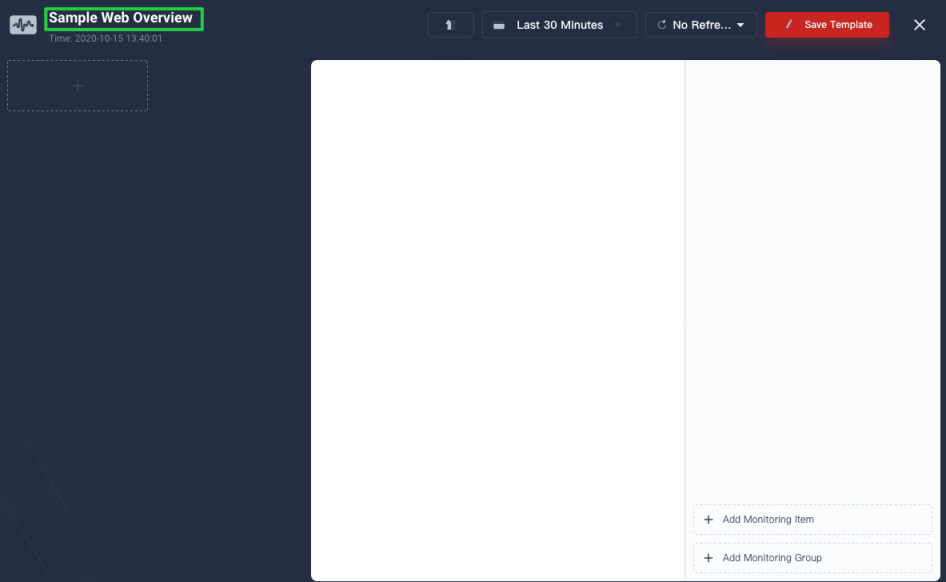
-
Click the plus icon on the left column to create a text chart.
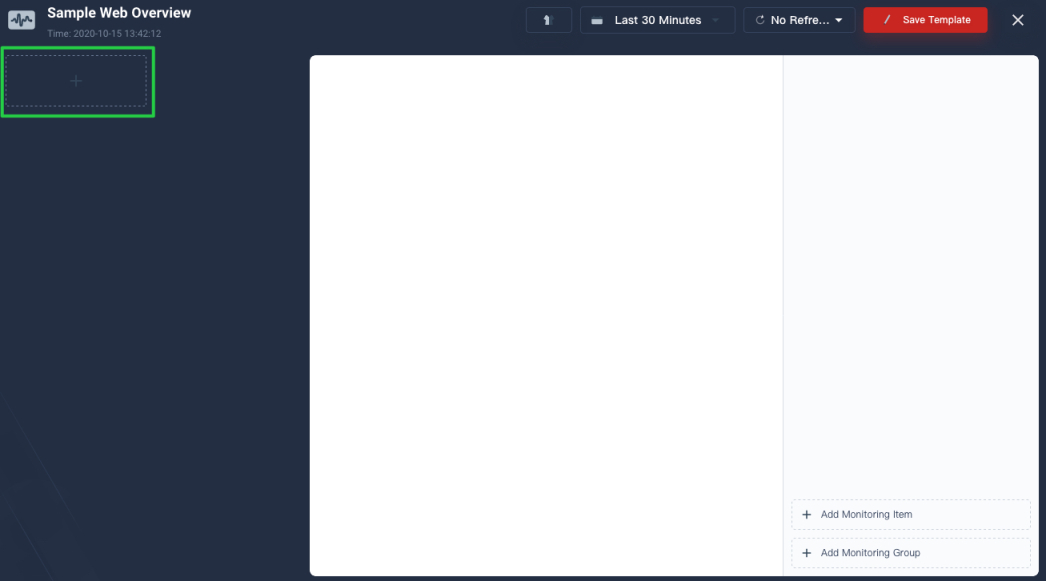
-
Type the PromQL expression
myapp_processed_ops_totalin the field Monitoring Metrics and give a chart name (for example,Operation Count). Click √ in the bottom-right corner to continue.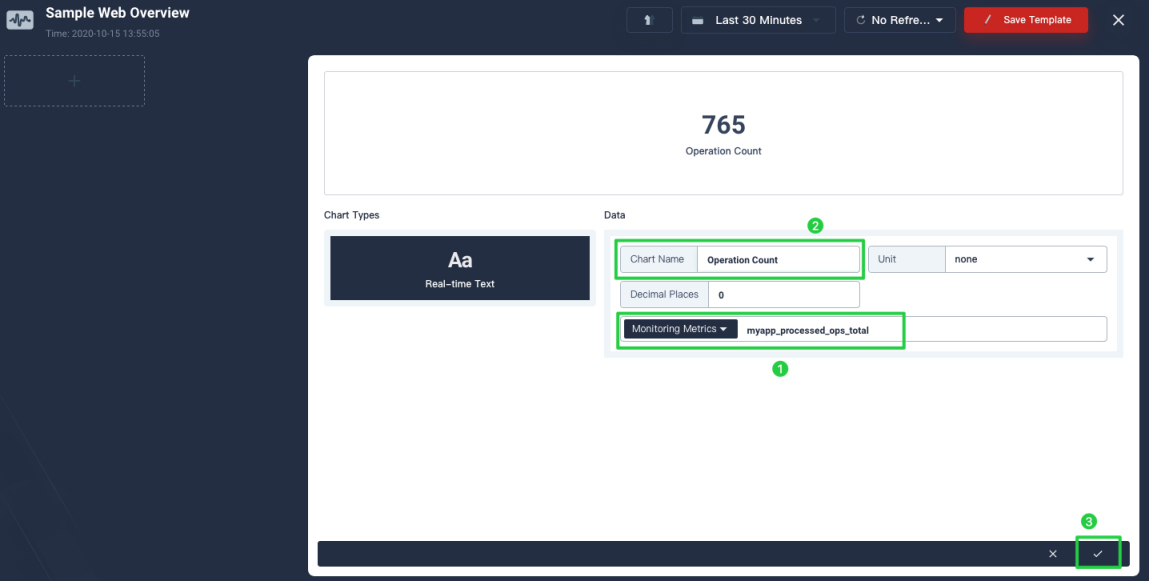
-
Click Add Monitoring Item to create a line chart.
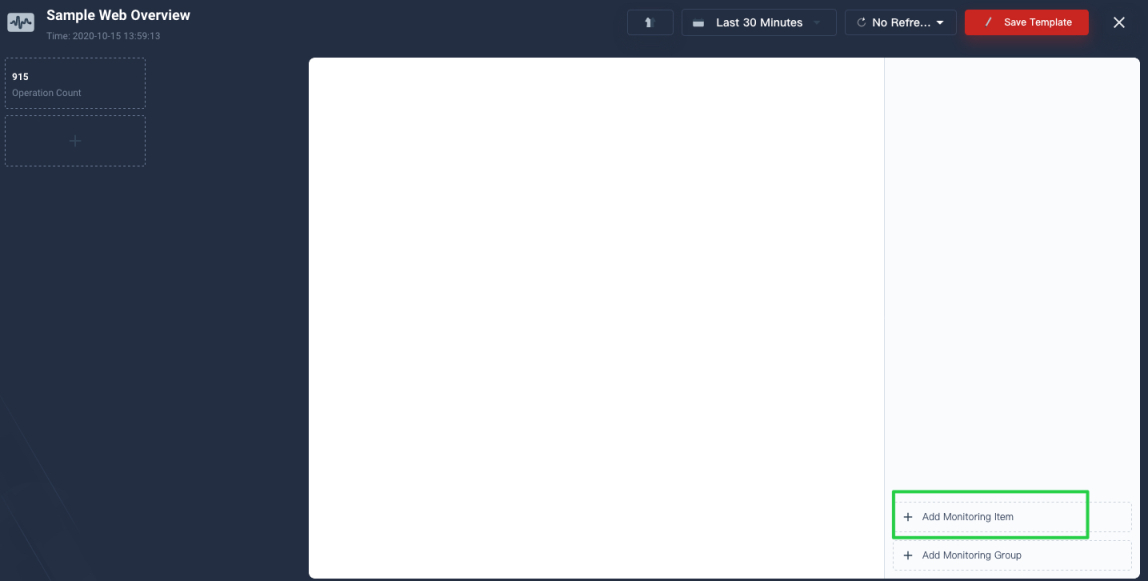
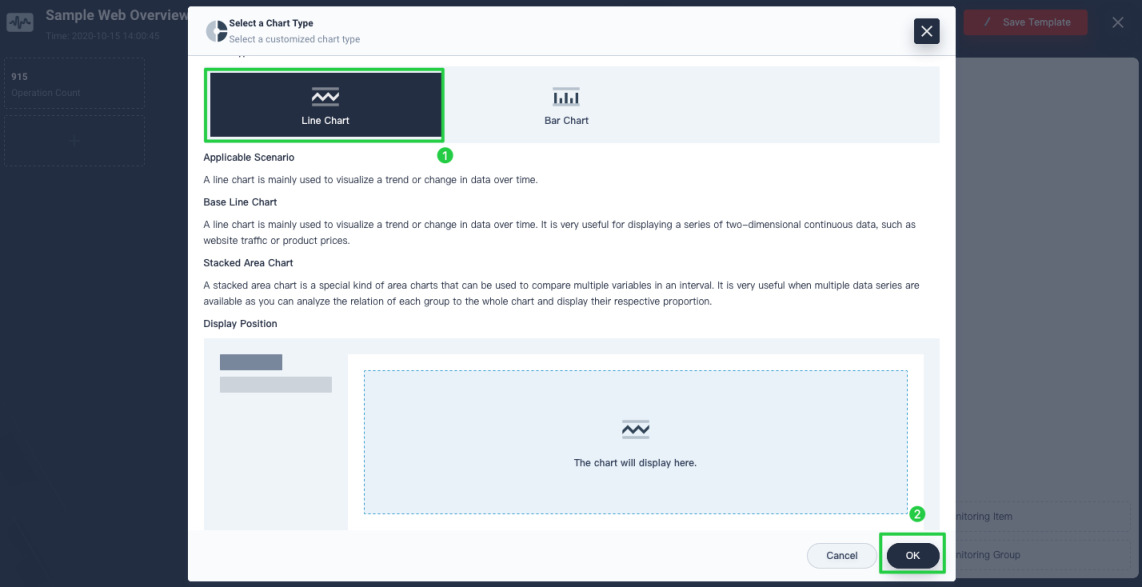
-
Type the PromQL expression
irate(myapp_processed_ops_total[3m])for Monitoring Metrics and name the chartOperation Rate. To improve the appearance, you can set Metric Name to{{service}}. It will name each line with the value of the metric labelservice. Next, set Decimal Places to2so that the result will be truncated to two decimal places.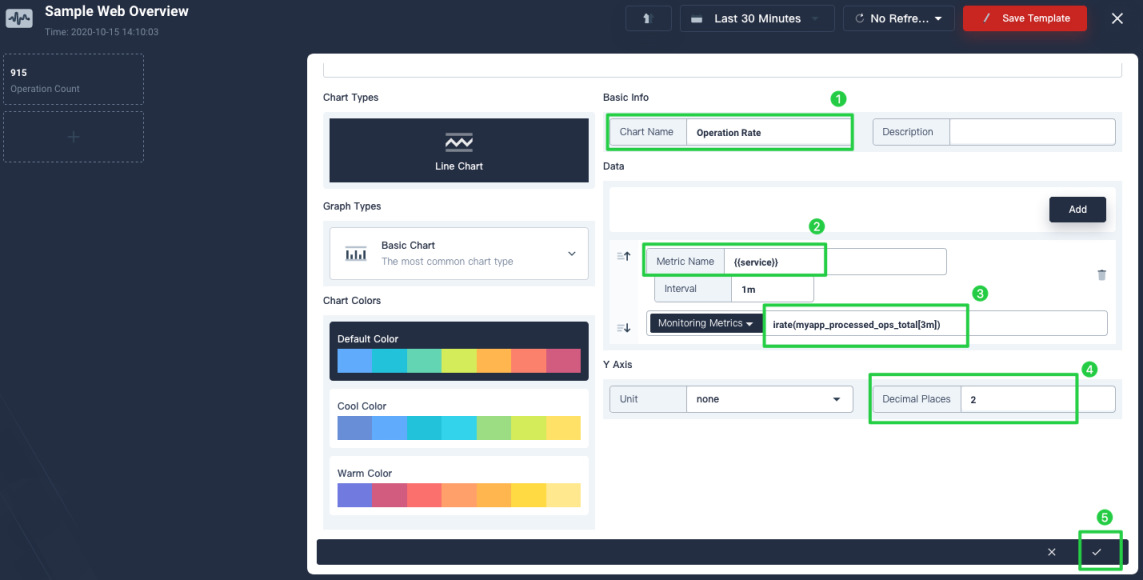
-
Click Save Template to save it.
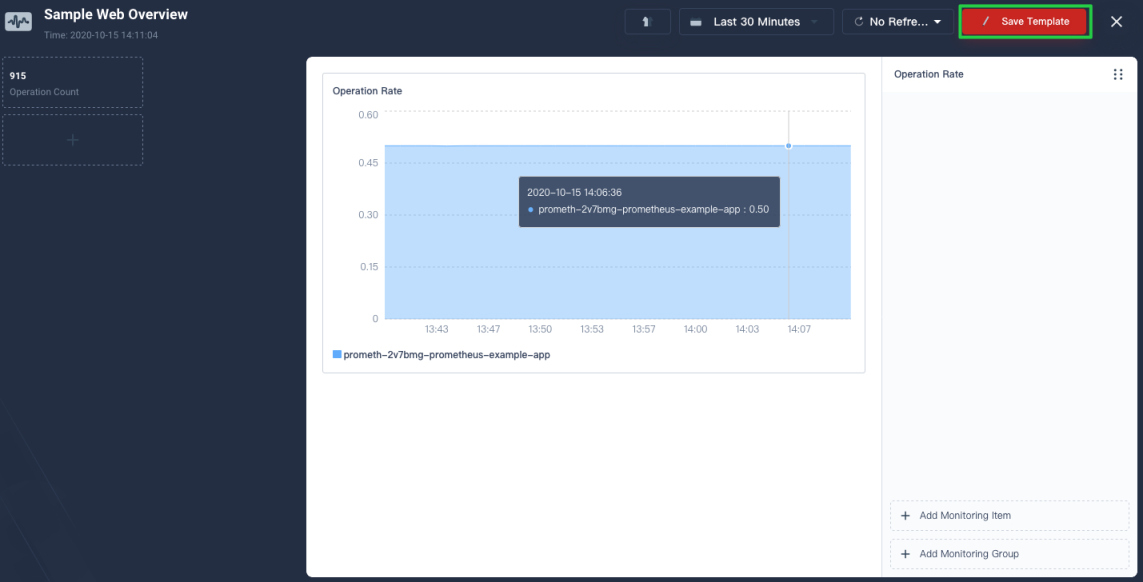
Feedback
Was this page Helpful?


 Previous
