Charts
KubeSphere currently supports two kinds of charts: text charts and graphs.
Text Chart
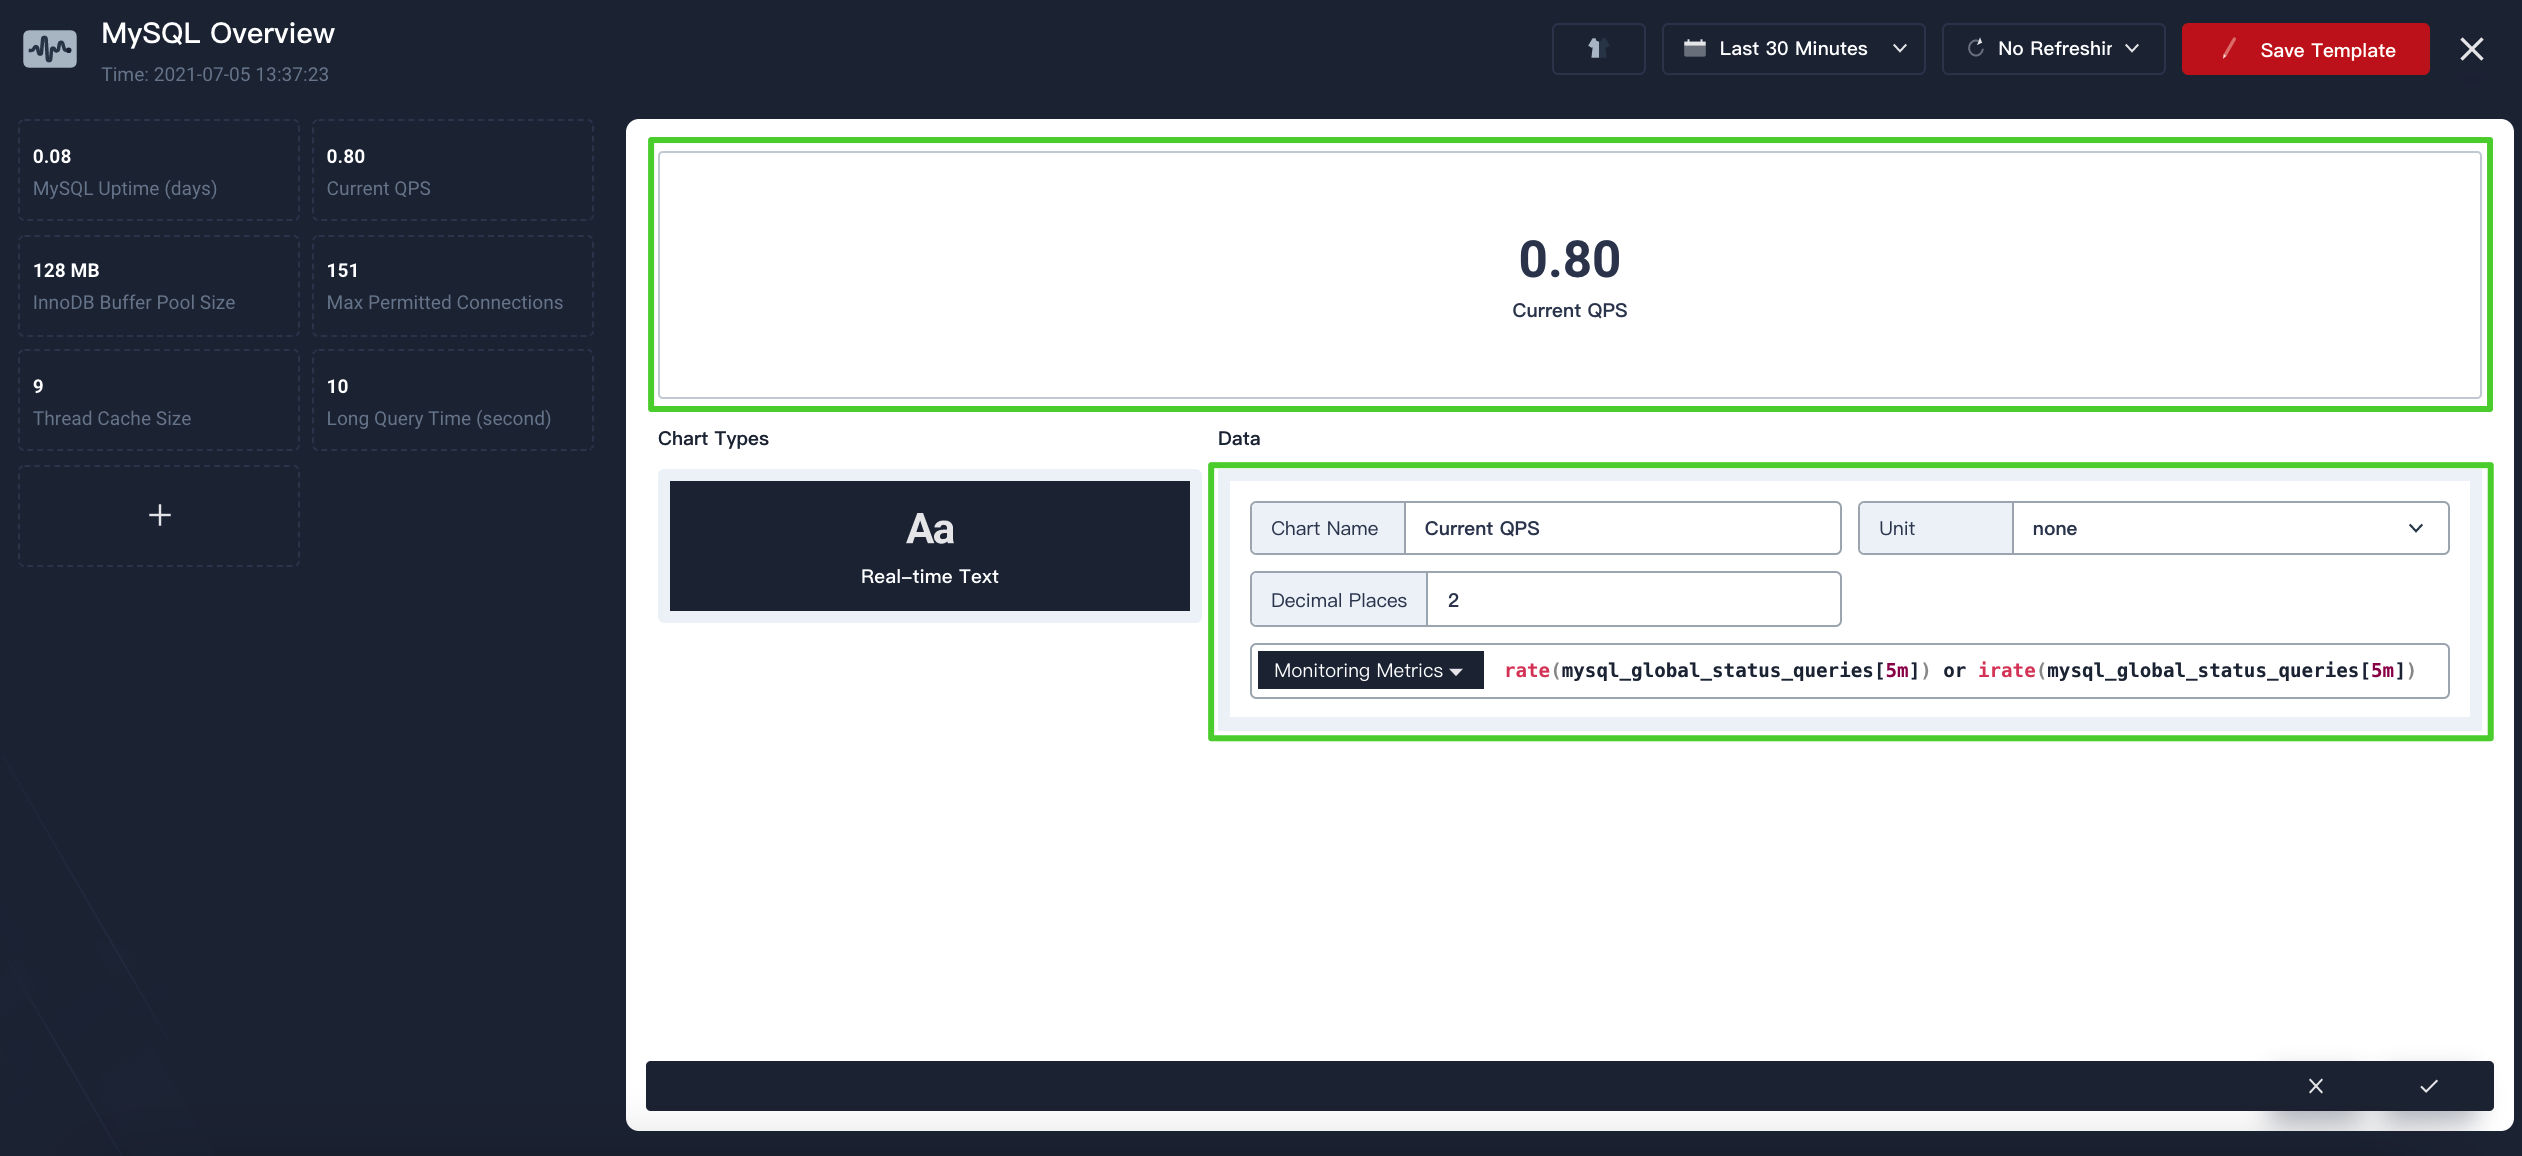
A text chart is preferable for displaying a single metric value. The editing window for the text chart is composed of two parts. The upper part displays the real-time metric value, and the lower part is for editing. You can enter a PromQL expression to fetch a single metric value.
- Chart Name: The name of the text chart.
- Unit: The metric data unit.
- Decimal Places: Accept an integer.
- Monitoring Metrics: A list of available Prometheus metrics.

Graph
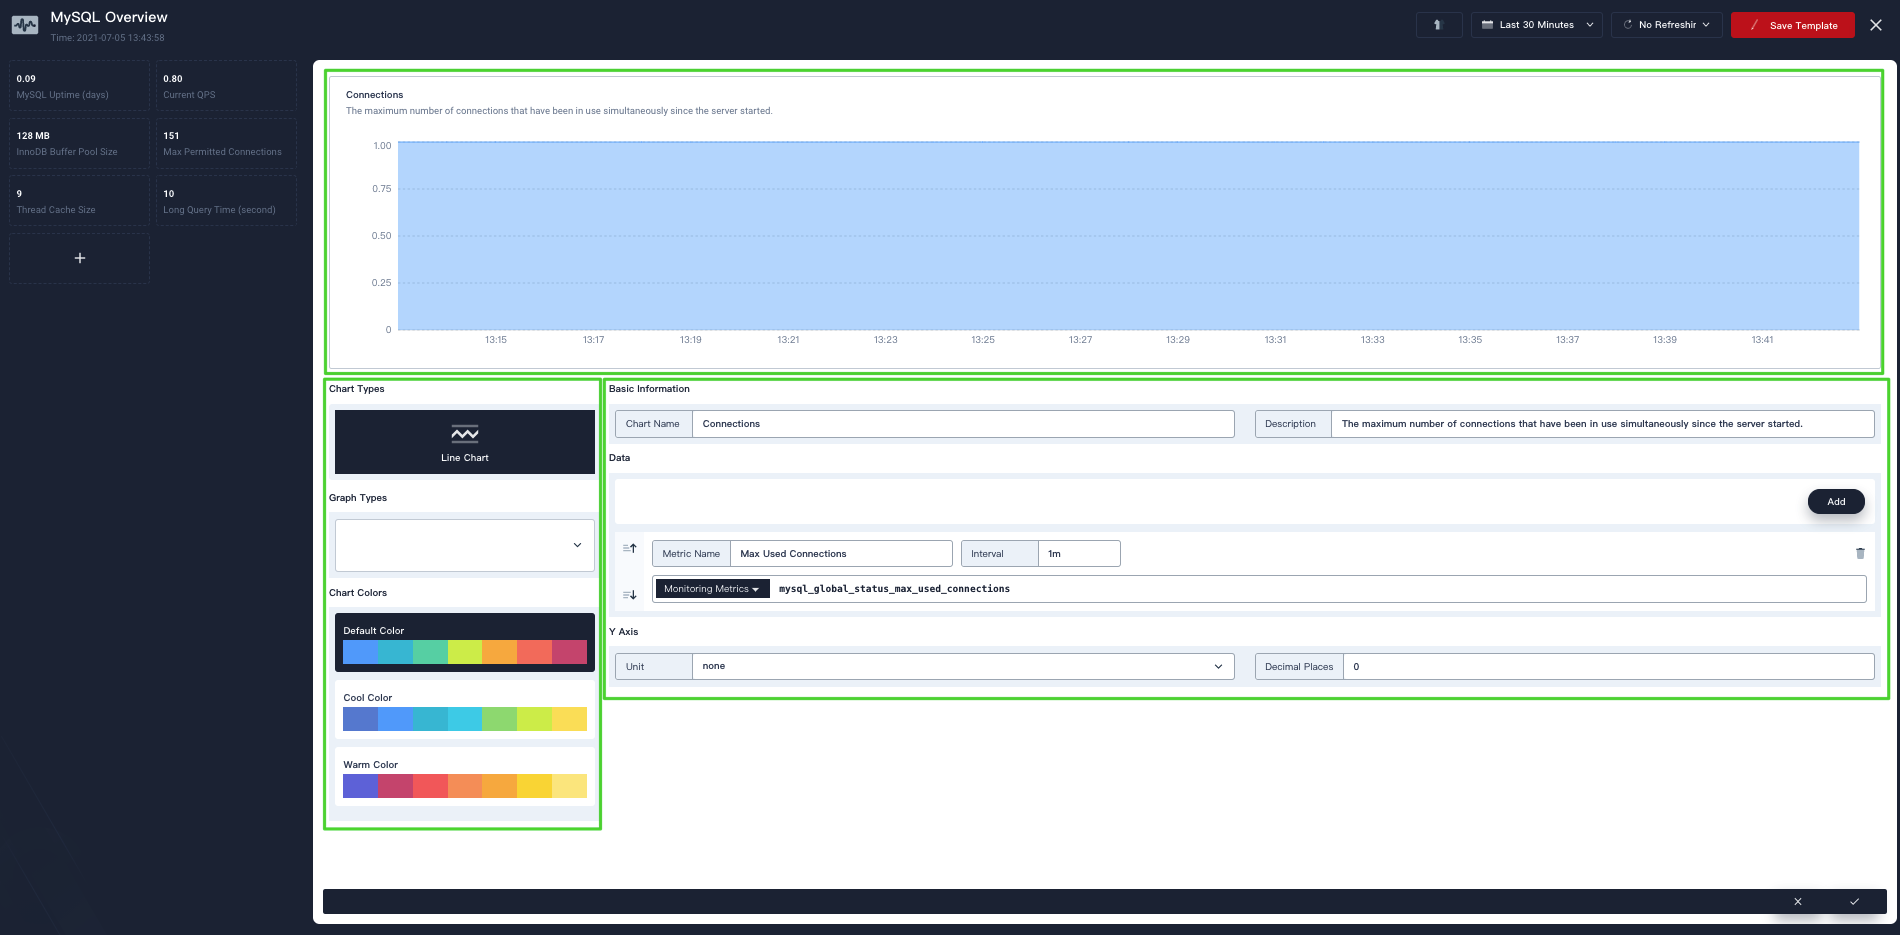
A graph is preferable for displaying multiple metric values. The editing window for the graph is composed of three parts. The upper part displays real-time metric values. The left part is for setting the graph theme. The right part is for editing metrics and chart descriptions.
- Graph Types: Support line charts and stacked charts.
- Chart Colors: Change line colors.
- Chart Name: The name of the chart.
- Description: The chart description.
- Add: Add a new query editor.
- Metric Name: Legend for the line. It supports variables. For example,
{{pod}}means using the value of the Prometheus metric labelpodto name this line. - Interval: The step value between two data points.
- Monitoring Metrics: A list of available Prometheus metrics.
- Unit: The metric data unit.
- Decimal Places: Accept an integer.

Feedback
Was this page Helpful?


 Previous
